


 806 860

follow-up and the percentage of patients with an event at a
given point in time. There were little time-to-event data,
that is, time to recurrence, hazard ratios,
p
values, and
multivariable adjustments. The main analysis is thus based
on a comparison of the overall percentage of patients with
an event during follow-up. The data from each study was
combined to obtain an overall estimate and compared using
a Pearson chi-square test. This was not possible for the
percentage of patients with an event at a given point in
time.
While it was possible to independently compare the
outcomes for the categories within each of the two grading
classifications, 1973 (G1 vs G2 vs G3) and 2004/2016
(PUNLMP vs LG vs HG), not all the studies provided end
point information for each grading classification. In order to
minimise the RoBwhen comparing 1973with 2004/2016, the
most reliable results were obtained when analysing only the
studies that assessed both grading classifications. Thus, each
of the two grading classifications is assessed on the same set
of patients so that there are no differences between the two
classifications concerning patient follow-up, characteristics,
or treatment. Sensitivity analyses were carried out using all
available information for each grading classification.
3.4.1.
Prognostic outcomes
3.4.1.1. Progression.
Overall, 13 studies provided data on
progression. In six studies, progression was defined as
any increase in disease stage, including Ta–T1, while in
seven studies, it was defined as an increase to stage T2 or
greater. In two studies
[18,32]where data for both
definitions were available, information on an increase to
T2 or greater was used.
3.4.1.1.1. Progression defined as muscle-invasive or metastatic disease
3.4.1.1.1.1. Comparisons only from studies that assessed both the
1973 and 2004/2016 classifications.
A direct comparison of the
two grading systems demonstrated progression by
1973 grade (G1 vs G2 vs G3) in 3% versus 9% versus 32%,
whereas for 2004/2016 grade (PUNLMP vs LG vs HG), 1%
versus 4% versus 25% progressed, respectively
( Table 2).
A separate subgroup analysis of HG T1 disease showed a
higher progression rate in G3 versus G2: 28% versus 12%.
3.4.1.1.1.2. Comparisons using all available data.
The overall
percentage of patients with progression varied between
grades within each classification; for the 1973 grade (G1 vs
G2 vs G3), 3% versus 10% versus 29% progressed, respec-
tively; for the 2004/2016 grade (PUNLMP vs LG vs HG), 1%
versus 4% versus 19% progressed, respectively
( Table 2).
3.4.1.1.2. Progression defined as any increase in disease stage
3.4.1.1.2.1. Comparisons only from studies that assessed both
1973 and 2004/2016 classifications.
When defining progression
as any stage increase, including Ta to T1, progression was
observed in (G1 vs G2 vs G3) 3% versus 8% versus 27% and
(PUNLMP vs LG vs HG) 2% versus 4% versus 22%,
respectively
( Table 2).
In LG Ta patients, we found a higher progression rate in
G2 patients as compared with G1 patients: 7% versus 1%.
3.4.1.1.2.2. Comparison using all available data.
Progression rates
were (G1 vs G2 vs G3) 3% versus 9% versus 28%, and
(PUNLMP vs LG vs HG) 2% versus 4% versus 19%, respectively.
3.4.1.2. Recurrence.
Eight studies provided information on the
number of patients with recurrence, but only five used both
grading systems
( Table 3).
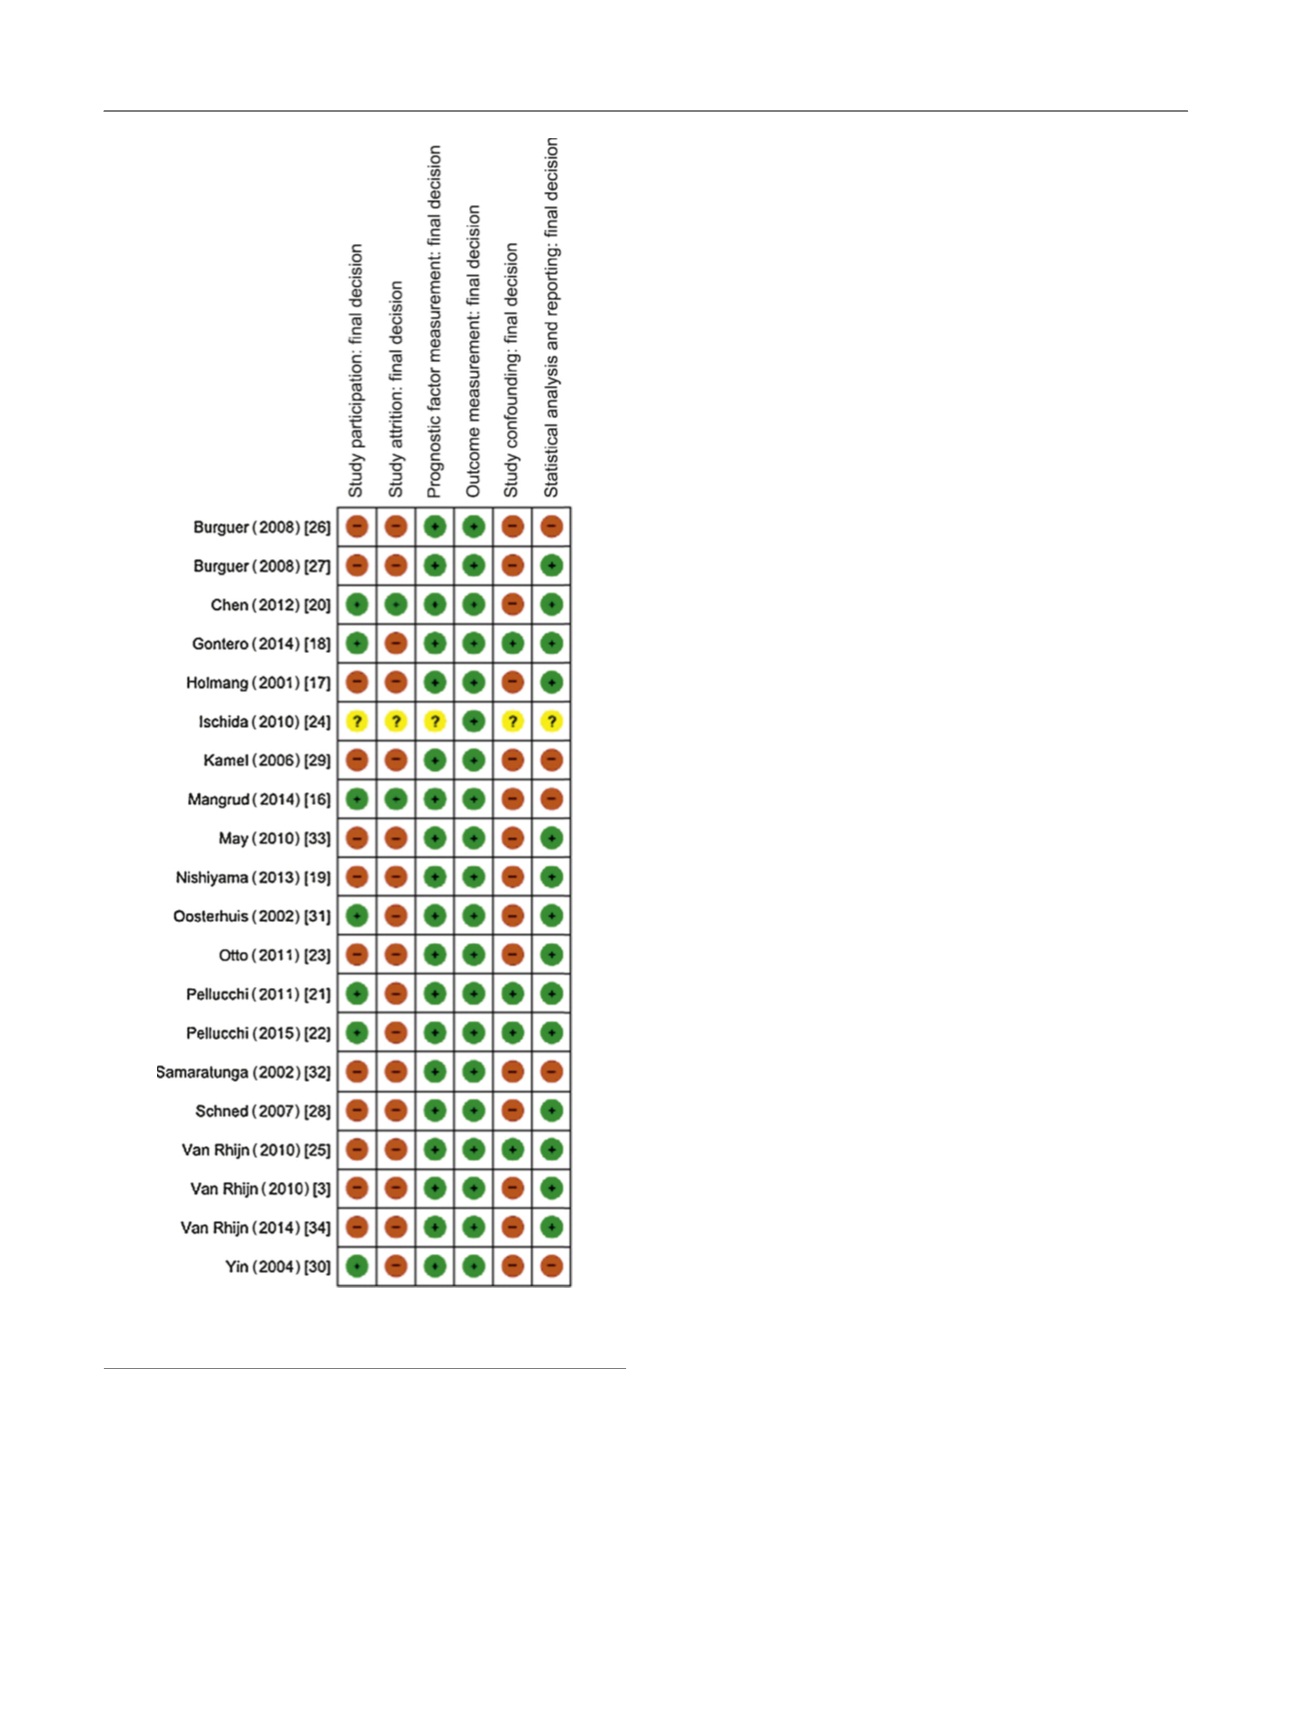
[(Fig._3)TD$FIG]
Fig. 3 – Risk of bias for included studies (
n
= 20). Green indicates low
risk, red indicates high risk, and yellow indicates unclear risk.
E U R O P E A N U R O L O G Y 7 2 ( 2 0 1 7 ) 8 0 1 – 8 1 3
806