


 809 860

3.4.1.2.1. Comparison of five studies that utilised both 1973 and 2004/
2016 classifications.
The pooled recurrence rates were (G1 vs
G2 vs G3) 33% versus 42% versus 63% and (PUNLMP vs LG vs
HG) 20% versus 38% versus 55%, respectively
( Table 3).
The majority of patients in these five studies had Ta
disease; a separate analysis in T1 patients was not possible
[16,20,26,30,33]. A subgroup analysis of T1 HG patients
revealed a higher recurrence rate in G3 patients compared
with G2 patients (68% vs 50%)
[22] .3.4.1.2.2. Comparisons using all available data.
The percentage of
patients with recurrence using the 1973 grade (G1 vs G2 vs
G3) was 33% versus 44% versus 65%, respectively. For the
2004/2016 grade (PUNLMP vs LGvsHG), recurrence occurred
in 28% versus 43% versus 58%, respectively
( Table 3).
Separate analysis of Ta patients revealed higher recur-
rence rates in G3 disease (G1 vs G2 vs G3): 39% versus 41%
versus 71%, respectively; in Ta patients, PUNLMP patients
have lower recurrence rates than LG or HG patients: 28%
versus 52% versus 60%, respectively. No comparisons were
possible in T1 patients
( Table 3).
3.4.1.3. Death due to bladder cancer.
Only one study provided
limited information regarding death due to bladder cancer,
so no conclusions could be drawn
[29].
3.4.1.4. Death due to any cause.
Information on all-cause
mortality was available on a limited basis in two studies
[18,28], and only one study contributed to the analysis
[31]. In this study, death rates for patients with the best and
worst prognosis seem to be similar in the two grading
classifications, but no conclusions can be drawn.
3.4.2.
Reproducibility and repeatability outcomes
3.4.2.1. Reproducibility.
The interobserver agreement and kap-
pa values for the 1973 and 2004/2016 WHO classifications
are presented in
Table 4.
The interobserver agreement for the 1973 classification
ranged from 38% to 89% (kappa values from 0.003 to 0.68).
Agreement in combined assessment of G1 + G2 versus G3
tumours in two studies
[3,16]was higher than in separate
assessment of G1 versus G2 versus G3 tumours (80–89% vs
39–66%; kappa values 0.44–0.68 vs 0.15–0.68). The interob-
server agreement for the 2004/2016 classification ranged
from 43% to 100% (kappa values 0.17–0.70). Only one study
assessed the agreement between two pathologists in a
combined review of PUNLMP + LG versus HG tumours
[3] .It
showed slightly better reproducibility than for a separate
analysis of PUNLMP versus LGversusHG tumours (73–86%vs
43–66%, kappa values 0.46–0.72 vs 0.17–0.48). In this study,
two additional pathologists assessed slides according to
2004/2016 WHO classification only. The interobserver
agreement for the separate review of PUNLMP versus LG
versus HG tumours between these two pathologists andwith
the latter two pathologists ranged from 38% to 74% (kappa
values from 0.13 to 0.58) and for combined review of
PUNLMP + LG versus HG tumours ranged from 65% to 88%
(kappa values from 0.30 to 0.73).
3.4.2.2. Repeatability.
The intraobserver repeatability and
kappa values for the 1973 and 2004/2016 WHO classifica-
tions are presented in
Table 5. Only two studies assessed the
repeatability of both grading systems
[3,15]. The intraob-
server agreement for the 1973 WHO grading classification
ranged from 63% to 95% (kappa values 0.61–0.88).
Repeatability for combined assessment of G1 + G2 versus
G3 tumours was slightly higher than that for a separate
analysis of G1 versus G2 versus G3 tumours (88–95% vs
63–81%, kappa values 0.64–0.88 vs 0.61–0.69). The
intraobserver agreement for the 2004/2016 WHO grading
classification ranged from 71% to 93% (kappa values 0.56–
0.83). In the only study that assessed the difference between
combined and separate pathological reviews, repeatability
of group PUNLMP + LG versus HG was higher than that of
PUNLMP versus LG versus HG (86–90% vs 71–82%, kappa
values 0.68–0.80 vs 0.56–0.69)
[3]. In this study, two
additional pathologists assessed slides twice using the
2004/2016WHO classification with 72% and 88% agreement
for separate review of PUNLMP versus LG versus HG (kappa
values 0.55 and 0.81, respectively), and 85% and 97%
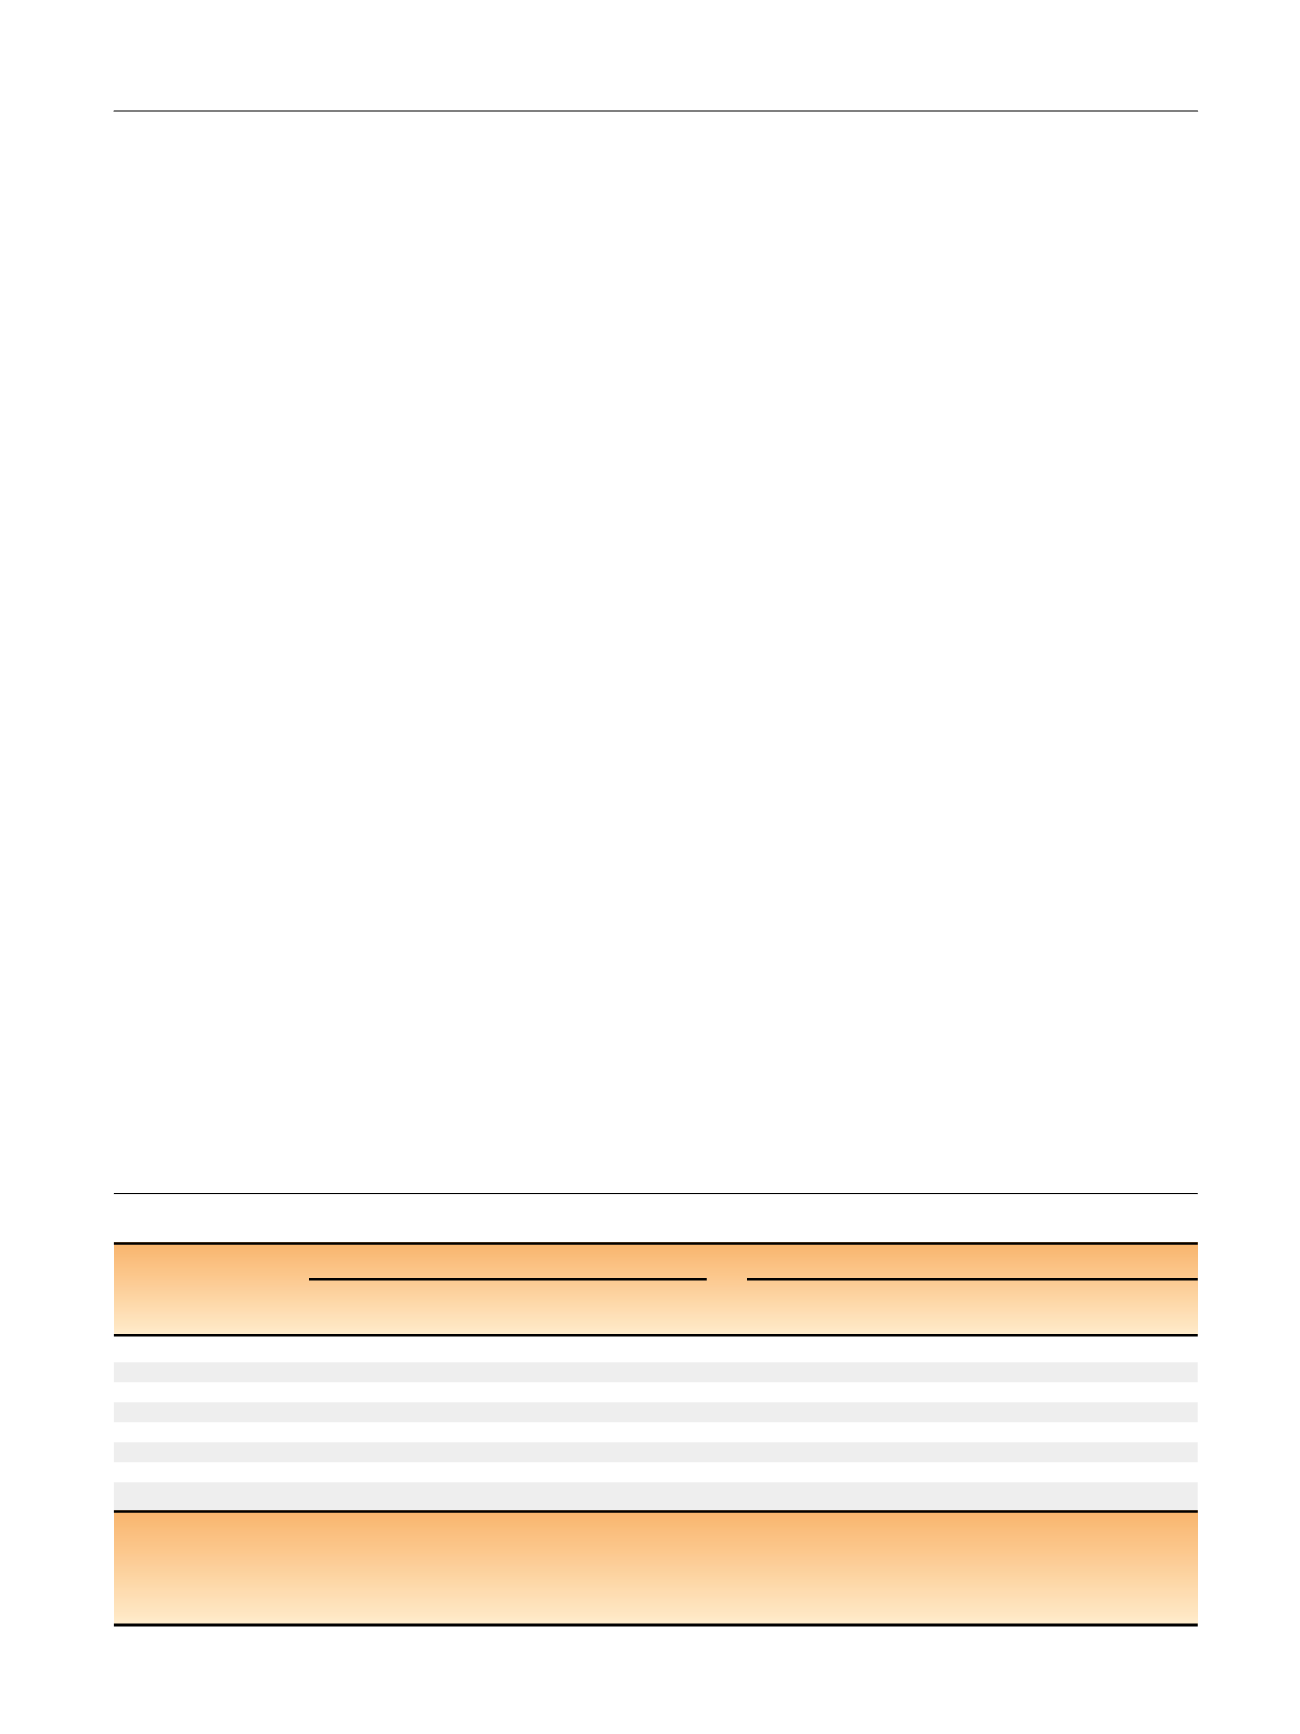
Table 4 – Interobserver reproducibility for the 1973 and 2004/2016 WHO classifications
1973 WHO classification
2004/2016 WHO classification
Study
Type of
analysis
Agreement
(95% CI)
Kappa
(95% CI)
Type of
analysis
Agreement
(95% CI)
Kappa
(95% CI)
Mangrud (2014)
[16]G1 vs G2 vs G3
66% (59–73%)
0.68 (0.57–0.78)
LG
100%
G1 + G2 vs G3
89% (83–93%)
0.68 0.56–0.80)
HG
66%
G1
89%
LG vs HG
87% (81–91%)
0.70 (0.59–0.81)
G2
56%
G3
65%
van Rhijn (2010)
[3]G1 vs G2 vs G3
a39–54%
0.15–0.32
PUNLMP vs LG vs HG
a43–66%
0.17–0.48
G1 + G2 vs G3
a80–85%
0.44–0.58
PUNLMP + LG vs HG
a73–86%
0.46–0.72
May (2010)
[33] bG1 vs G2 vs G3
c38–73%
0.003–0.365
PUNLMP vs LG vs HG
c71–82%
0.296–0.516
CI = confidence interval; G1 = grade 1; G2 = grade 2; G3 = grade 3; HG = high grade; LG = low grade; PUNLMP = papillary urothelial neoplasm with low
malignant potential; WHO = World Health Organization.
a
Pathologist A versus pathologist D (analysis of a total of four different combinations of two rounds of the grading assessment).
b
Only Ta tumours included.
c
Pathologist A versus B versus C versus D (a total of six pairwise comparisons).
E U R O P E A N U R O L O G Y 7 2 ( 2 0 1 7 ) 8 0 1 – 8 1 3
809