


 672 860

culpable of driving transformation and expansion of tumor
clones
[3]. Nonetheless, apart from hypoxia, it is lesser
known if other field-wide effects have a role in therapeutic
resistance and tumor aggression.
Nimbosus
, therefore,
represents a novel and potentially late-occurring ‘‘aggres-
sion’’ field defect, and the weak association of IDC/CA with
hypoxia might suggest for hypoxia as a bystander
phenomenon following genomic instability and
SChLAP1
expression in the evolution of IDC/CA+ prostate cancer.
The existence of a prostate cancer
nimbosus
that most
strongly predicts for failure of primary therapy and
metastatic recurrence argues for a multimodal signature
as an ideal biomarker. In addition to PGA
[5,6]and
SChLAP1
expression
[21,22], a series of other molecular biomarkers
have been proposed
[14,15,30–32]; however, technical and
financial challenges limit their utility in the clinical setting.
Moreover, the prediction accuracy of these molecular tests
can be affected by intratumoral genomic heterogeneity
[33], as highlighted by the potential disadvantages of
limited sampling and false negatives when employing
SChLAP1
RNA-ISH on TMA for detecting IDC/CA. Given that
IDC and CA subpathologies are hallmarks of
nimbosus
,
pathological screening of these lesions represents a simpler
and practical method for identifying patients with aggres-
sive prostate cancer. We propose that modern imaging
(positron emission tomography, functional magnetic reso-
nance imaging, etc.) for surveillance of metastasis, in
conjunction with prospective clinical trials of treatment
Table 2 – Intraductal carcinoma (IDC), cribriform architecture (CA), and percentage of genome alteration (PGA) are prognostic for metastasis
in the pooled cohort
Univariable (
N
= 829,
events = 52)
Multivariable (clinical + IDC/
CA;
N
= 805,events = 49);Harrell’s
C-index = 0.786 (95%
CI = 0.606–0.966)
Multivariable (clinical + IDC/
CA + PGA;
N
= 422,
events = 36);Harrell’s C-
index = 0.805 (95%
CI = 0.615–0.995)
Pooled Canadian and MSKCC cohorts
HR (95% CI)
p
value
HR (95% CI)
p
value
HR (95% CI)
p
value
Age (continuous)
0.99 (0.95–1.03)
0.59
–
–
[3_TD$DIFF]
cT
[1_TD$DIFF]
category
cT2b/c vs cT1/T2a (ref.)
1.16 (0.58–2.31)
0.68
1.07 (0.5–2.27)
0.86
0.97 (0.39–2.38)
0.95
cT3 vs cT1/2a (ref.)
4.01 (1.5–10.72)
0.0057
1.19 (0.4–3.58)
0.76
1.15 (0.32–4.11)
0.83
[4_TD$DIFF]
GS
7 vs 6 (ref.)
3.57 (1.53–8.32)
0.0032
–
–
8/9 vs 6 (ref.)
7.06 (2.61–19.1)
<
0.001
–
–
ISUP grade
2 vs 1 (ref.)
1.84 (0.71–4.74)
0.21
–
–
3 vs 1
8.67 (3.55–21.16)
<
0.001
3.92 (2.11–7.29)
a<
0.001
3.05 (1.43–6.52)
a0.004
4/5 vs 1
7.01 (2.59–18.98)
<
0.001
PSA (continuous)
1.01 (1–1.01)
<
0.001
1.01 (1–1.01)
<
0.001
1.01 (1–1.01)
0.0016
IDC/CA
Present vs absent
3.99 (2.23-7.13)
<
0.001
3.31 (1.76-6.21)
<
0.001
2.09 (0.94-4.66)
0.072
PGA (continuous)
1.08 (1.04–1.11)
<
0.001
1.05 (1.01–1.09)
0.027
CI = confidence interval; GS = Gleason score; HR = hazards ratio; ISUP = International Society of Urological Pathology grading system for prostate cancer based
on GS; MSKCC = Memorial Sloan Kettering Cancer Center; PSA = prostate-specific antigen; ref. = reference.
a
ISUP grades 3 and 4/5, and grades 1 and 2 were grouped together for multivariable analyses due to comparable metastasis-free rates (Supplementary
Fig. 2).
Harrell’s C-index for the multivariable clinical only model was 0.761 (95% CI = 0.588–0.935). The
p
values are generated using Wald’s test.
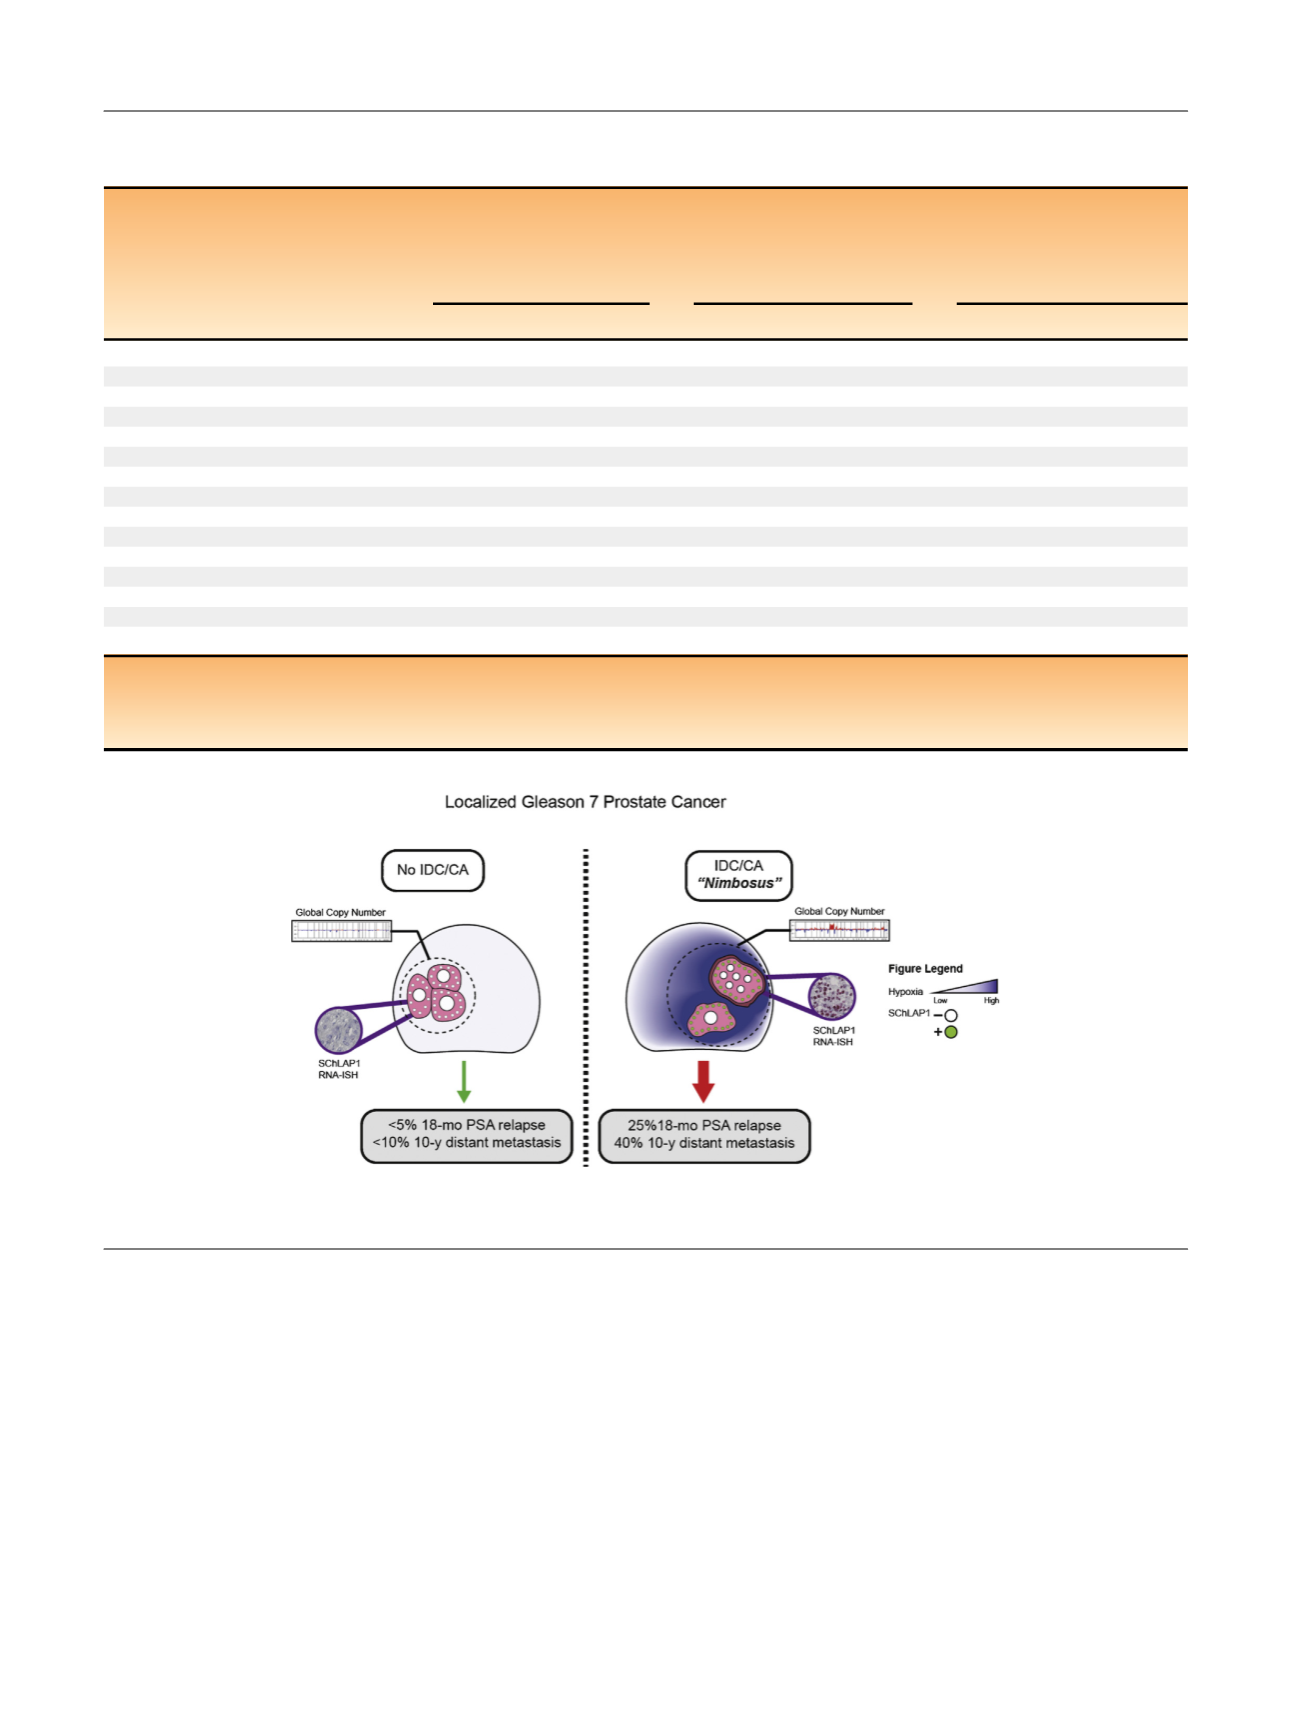
[(Fig._4)TD$FIG]
Fig. 4 – A prostate cancer
nimbosus
that is associated with intraductal (IDC) and cribriform (CA) subpathologies. CA = cribriform architecture;
IDC = intraductal carcinoma; PSA = prostate-specific antigen; RNA-ISH = RNA in situ hybridization.
E U R O P E A N U R O L O G Y 7 2 ( 2 0 1 7 ) 6 6 5 – 6 7 4
672