


 831 860

3.4.
AR-V7 status in whole blood predicts PSA-PFS, clinical PFS,
and OS
High AR-V7 levels were associated with significantly shorter
PSA-PFS (2.4 mo [95% confidence interval {CI} 1.8
–
3.0] vs
3.7 mo [95% CI 2.3
–
3.1];
p
<
0.001;
Fig. 3A), shorter clinical
PFS (2.7 mo [95% CI 2.3
–
3.1] vs 5.5 mo [95% CI 4.4
–
6.6];
p
<
0.001;
Fig. 3B), and shorter OS (4.0 mo [95% CI 2.0
–
6.0]
vs 13.9 mo [95% CI 9.6
–
18.2];
p
<
0.001;
Fig. 3 C). When
analyzed in multivariable Cox regression models, AR-V7
status remained significantly associated with PSA-PFS (HR
7.0, 95% CI 2.3
–
20.7), clinical PFS (HR 2.3, 95% CI 1.1
–
4.9),
and OS (HR 3.0, 95% CI 1.4
–
6.3;
Table 3). These findings are
supported by additional multivariable models with AR-V7
expression as a continuous variable. We observed some
Table 2
–
Multivariable logistic regression analyses
aVariable
Odds ratio
(95% CI)
p
value
AR-V7 (high vs low)
0.03 (0.00
–
0.70)
0.03
Abiraterone/enzalutamide
pretreatment (yes vs no)
0.25 (0.06
–
1.09)
0.06
ECOG performance score (0, 1, or 2)
0.62 (0.22
–
1.76)
0.37
Visceral metastases (yes vs no)
1.07 (0.29
–
3.94)
0.91
PSA (continuous, units of 100 ng/ml)
1.04 (0.97
–
1.12)
0.26
a
AR-V7 status, prior treatment with abiraterone or enzalutamide, Eastern
Cooperative Oncology Group (ECOG) performance status, presence of visceral
metastases, and serum prostate-specific antigen (PSA) levels were assessed
in one multivariable model for their association with therapy response (PSA
decline of 50% or more, binary variable, yes or no).
CI = confidence interval.
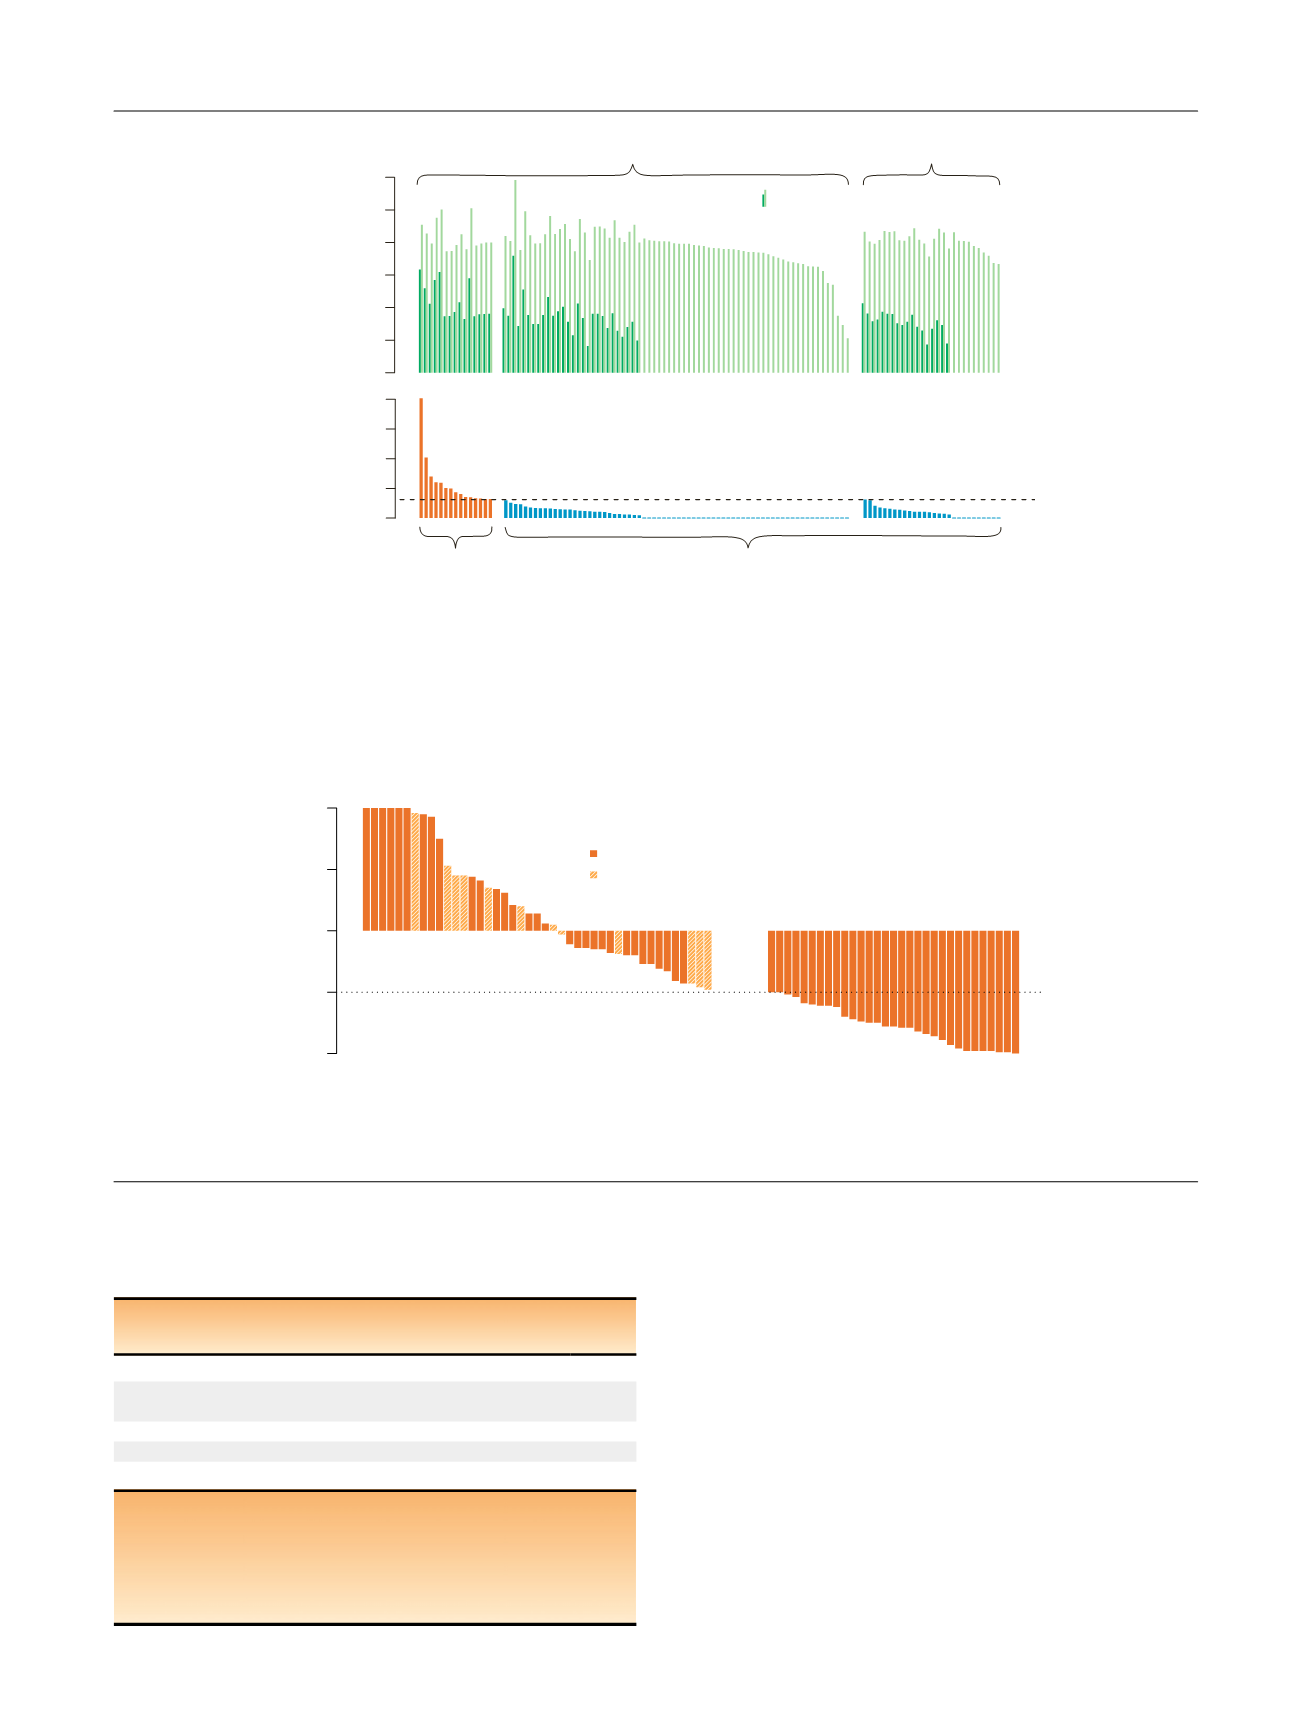
[(Fig._1)TD$FIG]
Copies per
ml reaction volume
1
10
100
1 k
10 k
100 k
1 M
Whole blood
AR-V7 fraction (%)
0
1
2
3
4
Patients (
n
= 85)
Healthy subjects (
n
= 28)
AR-V7 high
(
n
= 15)
AR-V7 low (
n
= 98)
A
B
Maximum AR-V7 fraction
in healthy subjects
AR-V7 AR-FL
from same person
Fig. 1
–
Quantification of androgen receptor splice variant 7 (AR-V7) in abiraterone- or enzalutamide-treated patients and healthy controls. (A) AR-V7
and full-length androgen receptor (AR-FL) mRNA levels in whole blood were quantified by droplet digital polymerase chain reaction for 85 patients
treated with abiraterone or enzalutamide and 28 healthy controls to determine tumor-independent AR-V7 and AR-FL background expression. (B) The
dotted line indicates a fraction of 0.6% AR-V7 transcripts over total AR (AR-V7 plus AR-FL) that was identified as threshold to distinguish AR-V7 high
versus low patient samples.
[(Fig._2)TD$FIG]
Best PSA change from baseline (%)
−100
−50
0
50
100
******
Non-responder (
n
= 43)
Responder (
n
= 31)
PSA decline of 50%
AR-V7 High
AR-V7 Low
31 31
12 0
Response
No Yes
Fig. 2
–
Waterfall plot of best prostate-specific antigen (PSA) changes and androgen receptor splice variant 7 (AR-V7) status. The dotted line depicts the
threshold for defining a PSA response ( 50% reduction in PSA serum level from baseline). Asterisks indicate an increase of
>
100% in best PSA change.
All of the patients with high AR-V7 levels (
n
= 12) in whole blood were non-responders, and none of the PSA responders (n = 31) exhibited high AR-V7
levels.
E U R O P E A N U R O L O GY 7 2 ( 2 0 17 ) 8 2 8
–
8 3 4
831