


 832 860

evidence of poor PSA-PFS (
p
= 0.15) and clinical PFS
(
p
= 0.06) with increasing AR-V7 expression, although this
association did not meet conventional levels of statistical
significance (Supplementary Tables 2 and 3, Supplementary
Figs. 2 and 3). Moreover, increasing AR-V7 expression was
confirmed as an independent prognostic factor for poor OS
(
p
= 0.02; Supplementary Table 4, Supplementary Fig. 4).
4.
Discussion
According to recent publications, AR-V7 expression in CTCs
is associated with primary resistance to AR-directed
therapies
[8,11,12]. In the present study, we established
an alternative liquid profiling approach to directly deter-
mine AR-V7 status in peripheral whole blood using ddPCR
for absolute quantification of AR-V7 and AR-FL mRNA
concentrations. Applying this assay to blood samples from
mCRPC patients from a prospective biorepository, we
demonstrated that high AR-V7 levels before treatment
initiation predict non-response to AR-directed therapy with
abiraterone or enzalutamide. In our study, high AR-V7 levels
in peripheral whole blood of mCRPC patients were
associated with failure to achieve a PSA response, as well
as shorter PSA-PFS, clinical PFS, and OS on multivariable
analysis. To the best of our knowledge, this is the first
standardized evaluation providing evidence for the use of
whole-blood AR-V7 levels as a marker of resistance to next-
generation AR-directed agents.
Our approach analyzing whole blood instead of CTCs is
supported by a recent study by Liu et al
[13]. They compared
AR-V7 detection rates using RNA isolated from either whole
blood or CTCs enriched via leukocyte depletion for ten
mCRPC patients. While bothmethods showed similar AR-V7
detection rates in a side-by-side comparison, AR-V7 levels
were approximately 40% lower in RNA isolated from CTCs,
suggesting higher sensitivity for the whole-blood RNA
approach compared to CTC enrichment via leukocyte
depletion. Moreover, in support of our data, Todenhöfer
et al
[14]reported an association of AR-V7 status in whole
blood with PSA-PFS and OS in 37 mCRPC patients
undergoing abiraterone treatment. While none of the four
AR-V7
–
positive patients achieved a PSA response with a
decline 50%, the statistical analysis did not reach
significance,
[2_TD$DIFF]
potentially
[17_TD$DIFF]
due
[18_TD$DIFF]
to the small sample size.
Furthermore, Qu et al
[15]used ddPCR to quantify mRNA
levels of AR-V7 inwhole blood frommCRPC patients treated
with abiraterone (
n
= 81) or enzalutamide (
n
= 51) and
found an association with time to treatment failure. A
limitation of their study was that the threshold for elevated
AR-V7 levels was determined somewhat arbitrarily without
the use of a control group.
In line with previous findings, we observed tumor-
independent background expression of AR-V7 mRNA in
whole blood from healthy men
[14]. This emphasizes the
necessity of determining robust and clearly defined thresh-
olds for AR-V7 levels in whole blood for translation into
clinical routine testing and standardization of clinical
decision-making. By contrast, solely qualitative AR-V7
detection in whole blood may lead to conflicting data as
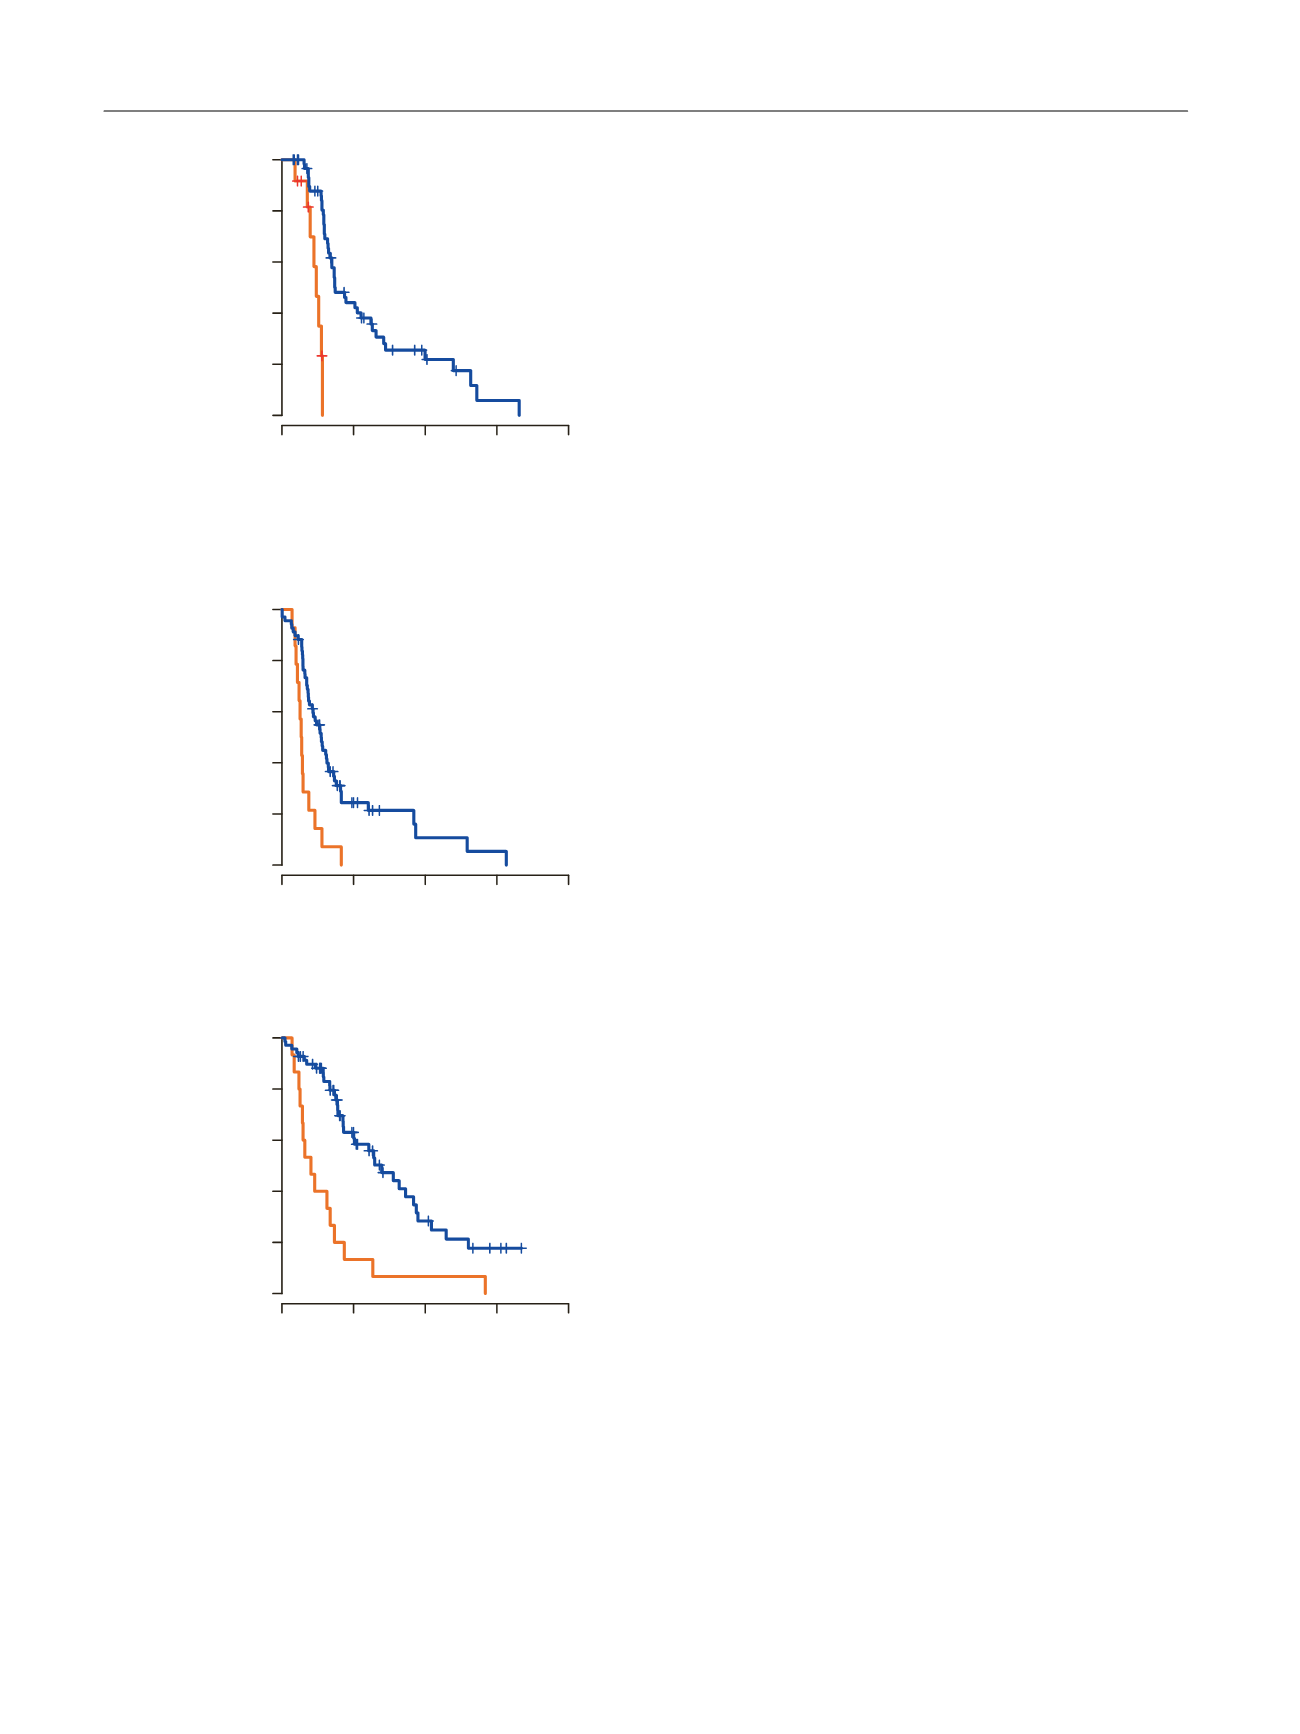
[(Fig._3)TD$FIG]
0
5
10
15
20
0.0
0.2
0.4
0.6
0.8
1.0
Time from abiraterone or enzalutamide initiation (mo)
Probality of PSA progression−free survival
p
< 0.001 (log-rank test)
No. at risk
AR-V7 High
12
AR-V7 Low
62
22
6
1
A
AR−V7 High
AR−V7 Low
0
10
20
30
40
0.0
0.2
0.4
0.6
0.8
1.0
Time from abiraterone or enzalutamide initiation (mo)
Probality of clinical progression−free survival
p
< 0.001 (log-rank test)
No. at risk
AR-V7 High
14
AR-V7 Low
68
9
2
1
B
AR−V7 High
AR−V7 Low
0
10
20
30
40
0.0
0.2
0.4
0.6
0.8
1.0
Time from abiraterone or enzalutamide initiation (mo)
Probality of overall survival
p
< 0.001 (log-rank test)
No. at risk
AR-V7 High
15
2
1
AR-V7 Low
69
27
9
3
C
AR−V7 High
AR−V7 Low
Fig. 3
–
Kaplan-Meier analysis. (A) Prostate-specific antigen (PSA)
progression-free survival, (B) clinical or radiographic progression-free
survival, and (C) overall survival according to androgen receptor splice
variant 7 (AR-V7) levels in whole blood.
E U R O P E A N U R O L O GY 7 2 ( 2 0 17 ) 8 2 8
–
8 3 4
832