


 662 860

[(Fig._1)TD$FIG]
rUCB
ypT0N0/pT0N0
14
20
33
41
62
8
10
18
28
41
33
45
71
123
262
8
13
27
51
139
15
20
33
42
62
8
10
19
29
41
35
48
78
140
262
11
16
30
61
139
15
20
33
42
62
8
10
19
29
41
35
48
78
140
262
11
16
30
61
139
0
0.2
0.4
0.6
0.8
1
8
6
4
2
0
Probability of RFS
Time (yr)
RC alone
NAC + RC
0
0.2
0.4
0.6
0.8
1
8
6
4
2
0
Probability of RFS
Time (yr)
RC alone
NAC + RC
0
0.2
0.4
0.6
0.8
1
8
6
4
2
0
Probability of CSS
Time (yr)
RC alone
NAC + RC
0
0.2
0.4
0.6
0.8
1
8
6
4
2
0
Probability of CSS
Time (yr)
RC alone
NAC + RC
0
0.2
0.4
0.6
0.8
1
8
6
4
2
0
Probability of OS
Time (yr)
RC alone
NAC + RC
0
0.2
0.4
0.6
0.8
1
8
6
4
2
0
Probability of OS
Time (yr)
RC alone
NAC + RC
p
= 0.5
p
= 1
p
= 0.4
p
= 0.02
p
= 0.01
p
= 0.003
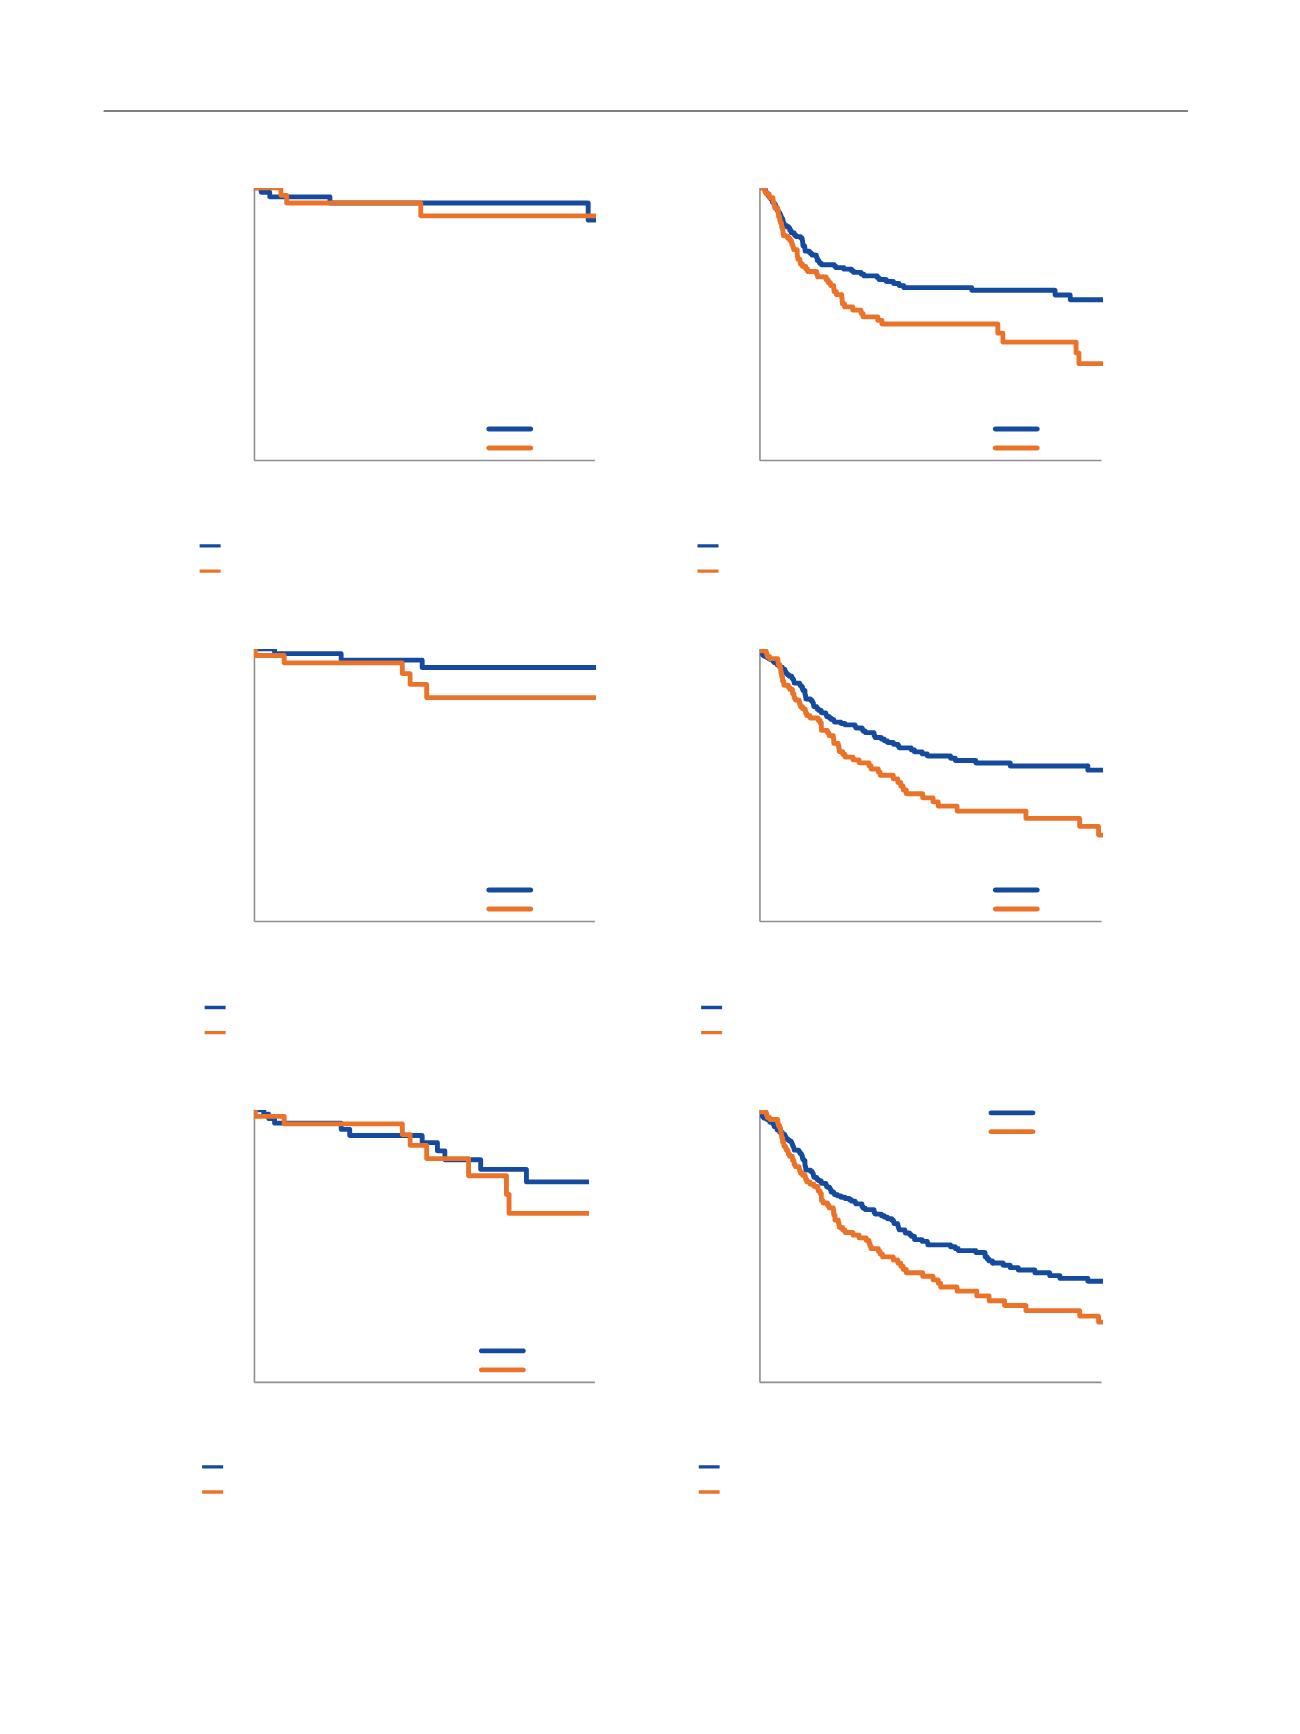
Fig. 1 – Kaplan Meier analyses for recurrence-free survival (RFS), cancer-specific survival (CSS), and overall survival (OS) for patients without (ypT0N0/
pT0N0) and with residual urothelial carcinoma of the bladder (rUCB) at radical cystectomy (RC) following neoadjuvant chemotherapy (NAC) in
comparison to pathologic stage–matched controls.
E U R O P E A N U R O L O G Y 7 2 ( 2 0 1 7 ) 6 6 0 – 6 6 4
662