


 848 860

categorized as low, intermediate, and high risk by biopsy
Decipher, respectively (Supplementary Fig. 1).
3.3.
Evaluation of Decipher for prediction of metastasis
We performed stratified MVA Cox models to determine the
performance of biopsy Decipher for predicting metastasis.
OnMVA, biopsy Decipher remained a significant predictor of
metastasis when adjusting for clinical variables or risk
models (NCCN or CAPRA). Biopsy Decipher had a HR of 1.37
(95% CI: 1.06–1.78,
p
= 0.018) per 10% increase when
adjusting for age, biopsy Grade Group, clinical stage, and
PSA. Similar results were obtainedwhen adjusting for CAPRA
or NCCN
( Table 2 ). We also evaluated the performance of
biopsy Decipher adjusting for clinical variables and first-line
treatment (RP or RT ADT). This analysis demonstrated that
biopsy Decipher was prognostic for metastasis (HR: 1.39, 95%
CI: 1.09–1.80) adjusting for first-line treatment and clinical
variables
( Table 3 ). When Decipher was analyzed as a
categorical variable on MVA, patients with high-risk Decipher
score (
>
0.60) had a HR of 4.30 (95% CI: 1.63–11.49,
p
= 0.003)
compared with low-risk patients (Supplementary Table 2).
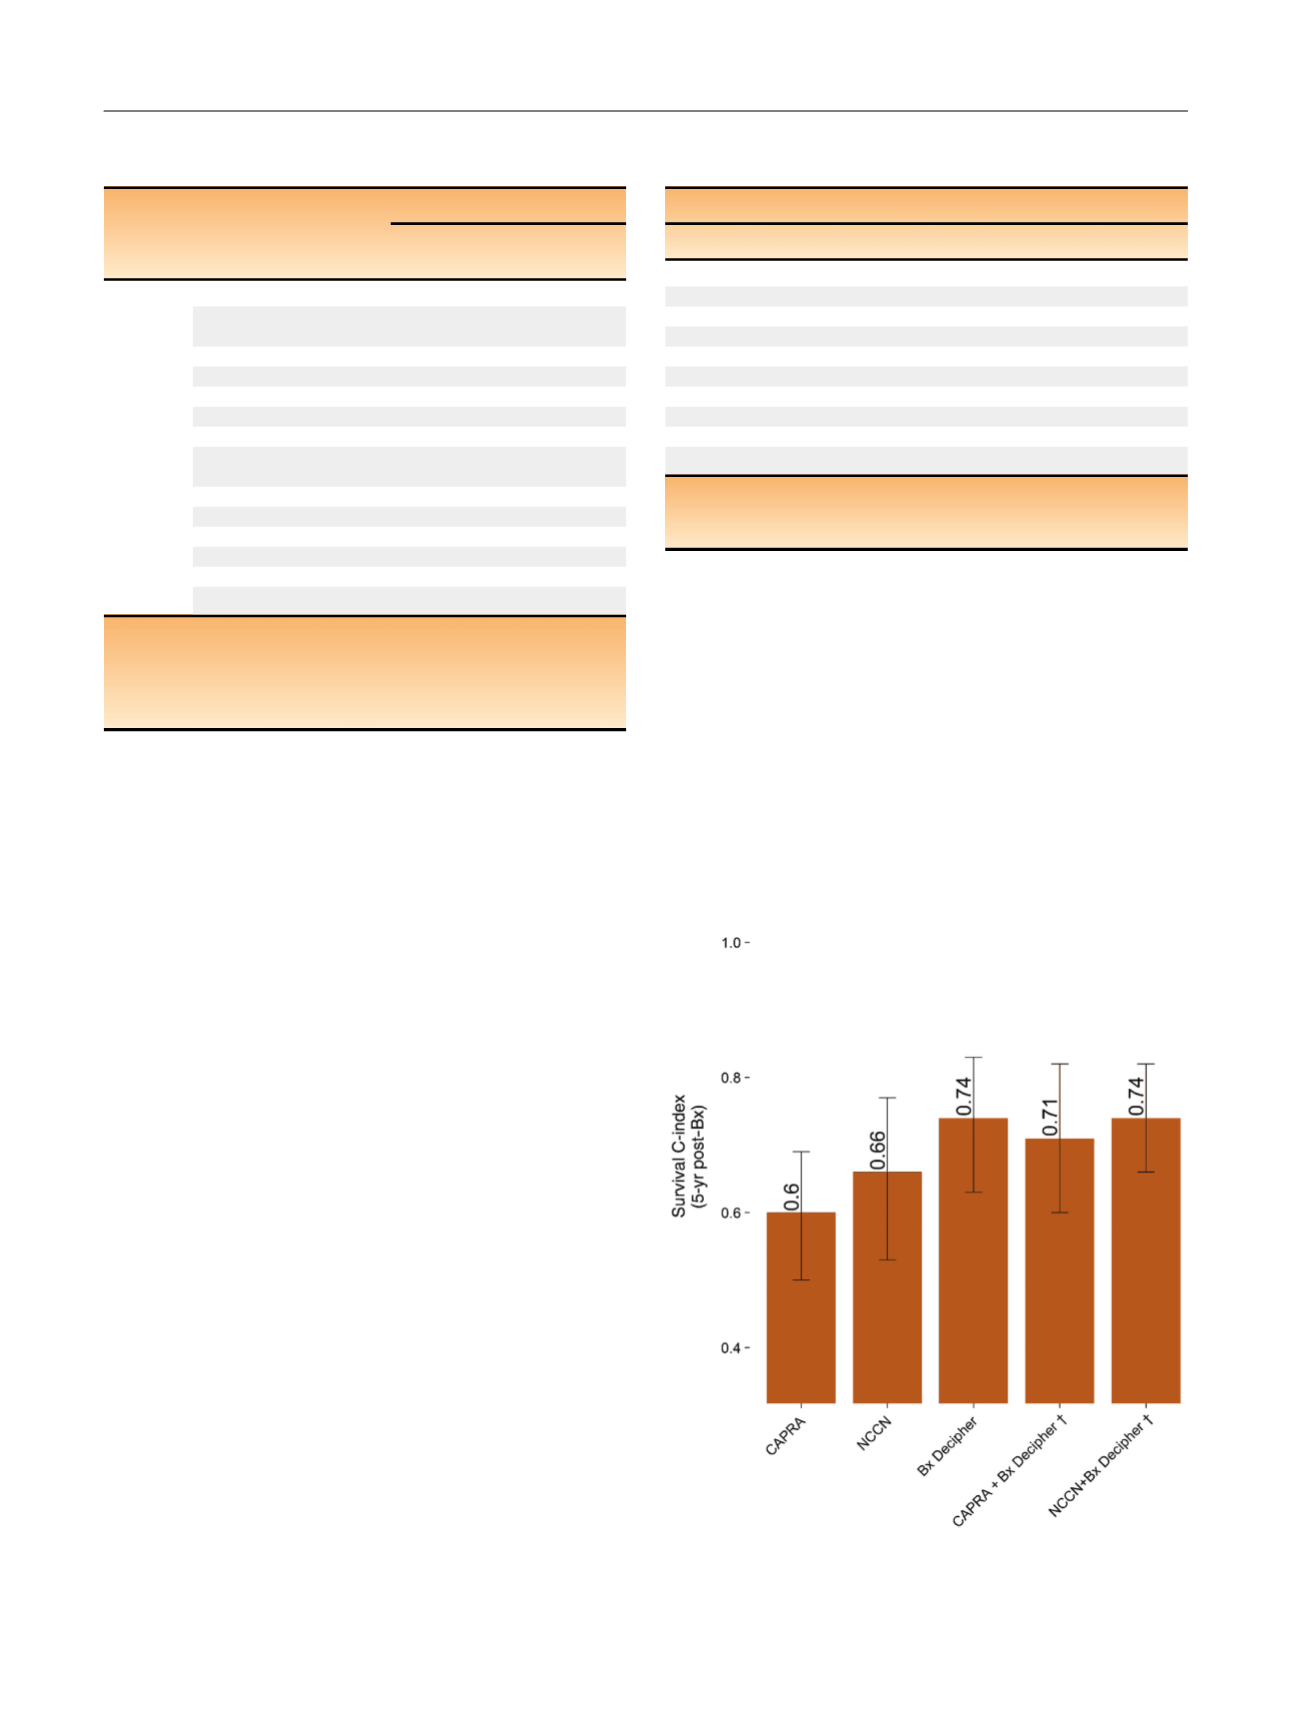
To evaluate the discriminatory performance of Decipher
and its added value to either NCCN or CAPRA, we employed
survival receiver operating characteristic analysis at 5-yr
post-biopsy. In this analysis, CAPRA, NCCN, and biopsy
Decipher had a c-index of 0.60 (95% CI: 0.50–0.69), 0.66
(95% CI: 0.53–0.77), and 0.74 (95% CI: 0.63–0.83), respec-
tively. Addition of biopsy Decipher to CAPRA improved the
c-index from 0.60 to 0.71 (95% CI: 0.60–0.82) and addition
of biopsy Decipher to NCCN improved the c-index from
0.66 to 0.74 (95% CI: 0.66–0.82;
Fig. 1 ). On decision curve
analysis, biopsy Decipher remained superior to the CAPRA
model (Supplementary Fig. 2).
Next, we used cumulative incidence curves to stratify
metastasis risk by clinical and genomic risk models. NCCN,
CAPRA, and biopsy Decipher all significantly stratified
metastasis risk (all
p
<
0.01;
Fig. 2). Patients with NCCN low,
intermediate, and high risk had 0%, 6.4%, and 14%metastasis
incidence by 5-yr postbiopsy, respectively
( Fig. 2). Similar
results were observed for CAPRA
( Fig. 2). Patients with
biopsy Decipher low, intermediate, and high risk had a
metastasis rate of 4.1%, 7.8%, and 21% by 5-yr post-biopsy,
respectively
( Fig. 2 ).
In a sensitivity analysis, because we had a small number
of low-risk patients, we evaluated only the subset of
Table 2 – Multivariable analysis (MVA) using institution as a
stratification variable for prediction of metastasis
Model
Variables
MVA
Hazard ratio
(95% CI)
p
value
Model 1
Bx Deciphe
r a1.37 (1.06–1.78)
0.018
Patient’s age at first
line treatment (yr)
1.04 (0.97–1.11)
0.25
Grade Group 1
Reference
1
Grade Groups 2–3
2.68 (0.50–17.2)
0.25
Grade Groups 4–5
4.29 (0.66–33.5)
0.13
Clinical stage T1c
Reference
1
Clinical stage T2a
1.07 (0.4–3.06)
0.9
log2 Pretreatment
PSA (ng/ml)
1.01 (0.68–1.48)
1
Model 2
CAPR
A b1.08 (0.83–1.41)
0.6
Bx Deciphe
r a1.44 (1.15–1.84)
0.002
Model 3
NCCN low
Reference
1
NCCN intermediate
8.85 (1.07–1151.1)
0.041
NCCN high
11.8 (1.16–1604.1)
0.034
Bx Deciphe
r a1.39 (1.15–1.69)
0.001
CAPRA = Cancer of the Prostate Risk Assessment; NCCN = National
Comprehensive Cancer Network; PSA = prostate-specific antigen;
RP = radical prostatectomy; RT = radiation therapy.
a
Decipher reported per 0.1 unit increase
.
b
CAPRA is reported per unit increase.
[(Fig._1)TD$FIG]
Fig. 1 – C-index for metastasis at 5-yr post-Bx.
y
C-index of the combined
models was corrected for optimism.
CAPRA = Cancer of the Prostate Risk Assessment; NCCN = National
Comprehensive Cancer Network.
Table 3 – Multivariable analysis (MVA) adjusting for treatment and
clinical data for prediction of metastasis
MVA
Variable
Hazard ratio (95% CI)
p
value
Patient’s age at first line treatment 1.03 (0.97–1.1)
0.29
log2 Pretreatment PSA (ng/ml)
1.00 (0.68–1.48)
1
Grade Group 1
Reference
1
Grade Groups 2–3
2.80 (0.65–16.2)
0.17
Grade Groups 4–5
4.78 (0.92–32.2)
0.063
Clinical stage T1c
Reference
1
Clinical stage T2a
1.09 (0.42–3.06)
0.9
Bx Deciphe
r a1.39 (1.09–1.8)
0.009
First-line treatment RP
Reference
1
First-line treatment RT ADT
0.73 (0.26–2.28)
0.6
ADT = androgen deprivation therapy; CI = confidence interval;
PSA = prostate-specific antigen.
a
Decipher reported per 0.1 unit increase
.
E U R O P E A N U R O L O G Y 7 2 ( 2 0 1 7 ) 8 4 5 – 8 5 2
848