


 859 860

Research Letter
What is a ‘‘Diagnostic Test Reference Range’’ Good for?
Parham Habibzadeh
a ,Mahboobeh Yadollahie
b ,Farrokh Habibzadeh
a , b , *Many medical texts and laboratory reports mention the
‘‘reference range’’ for diagnostic tests. The reference range
for a test is commonly defined as the interval between
the 2.5th and 97.5th percentiles of the distribution of test
results in a healthy population
[1] .A normal test value for
an individual does not imply that he or she does not have a
certain disease. Nor can we state that a person is diseased if
his or her test value falls outside this range. What a clinician
uses to interpret a test result to determine if a person has a
certain disease or not is the test cutoff value, which is
generally different from the upper or lower limit of the
reference range.
A test cutoff point is the value at which test results equal
to or above this value are considered positive; otherwise,
they are negative. The test cutoff value depends on the
characteristics of distributions of test values in both normal
and diseased populations. Furthermore, we need to
consider the pretest probability of the disease and an
estimate of the cost of a false-negative relative to a false-
positive test result
[2–4].
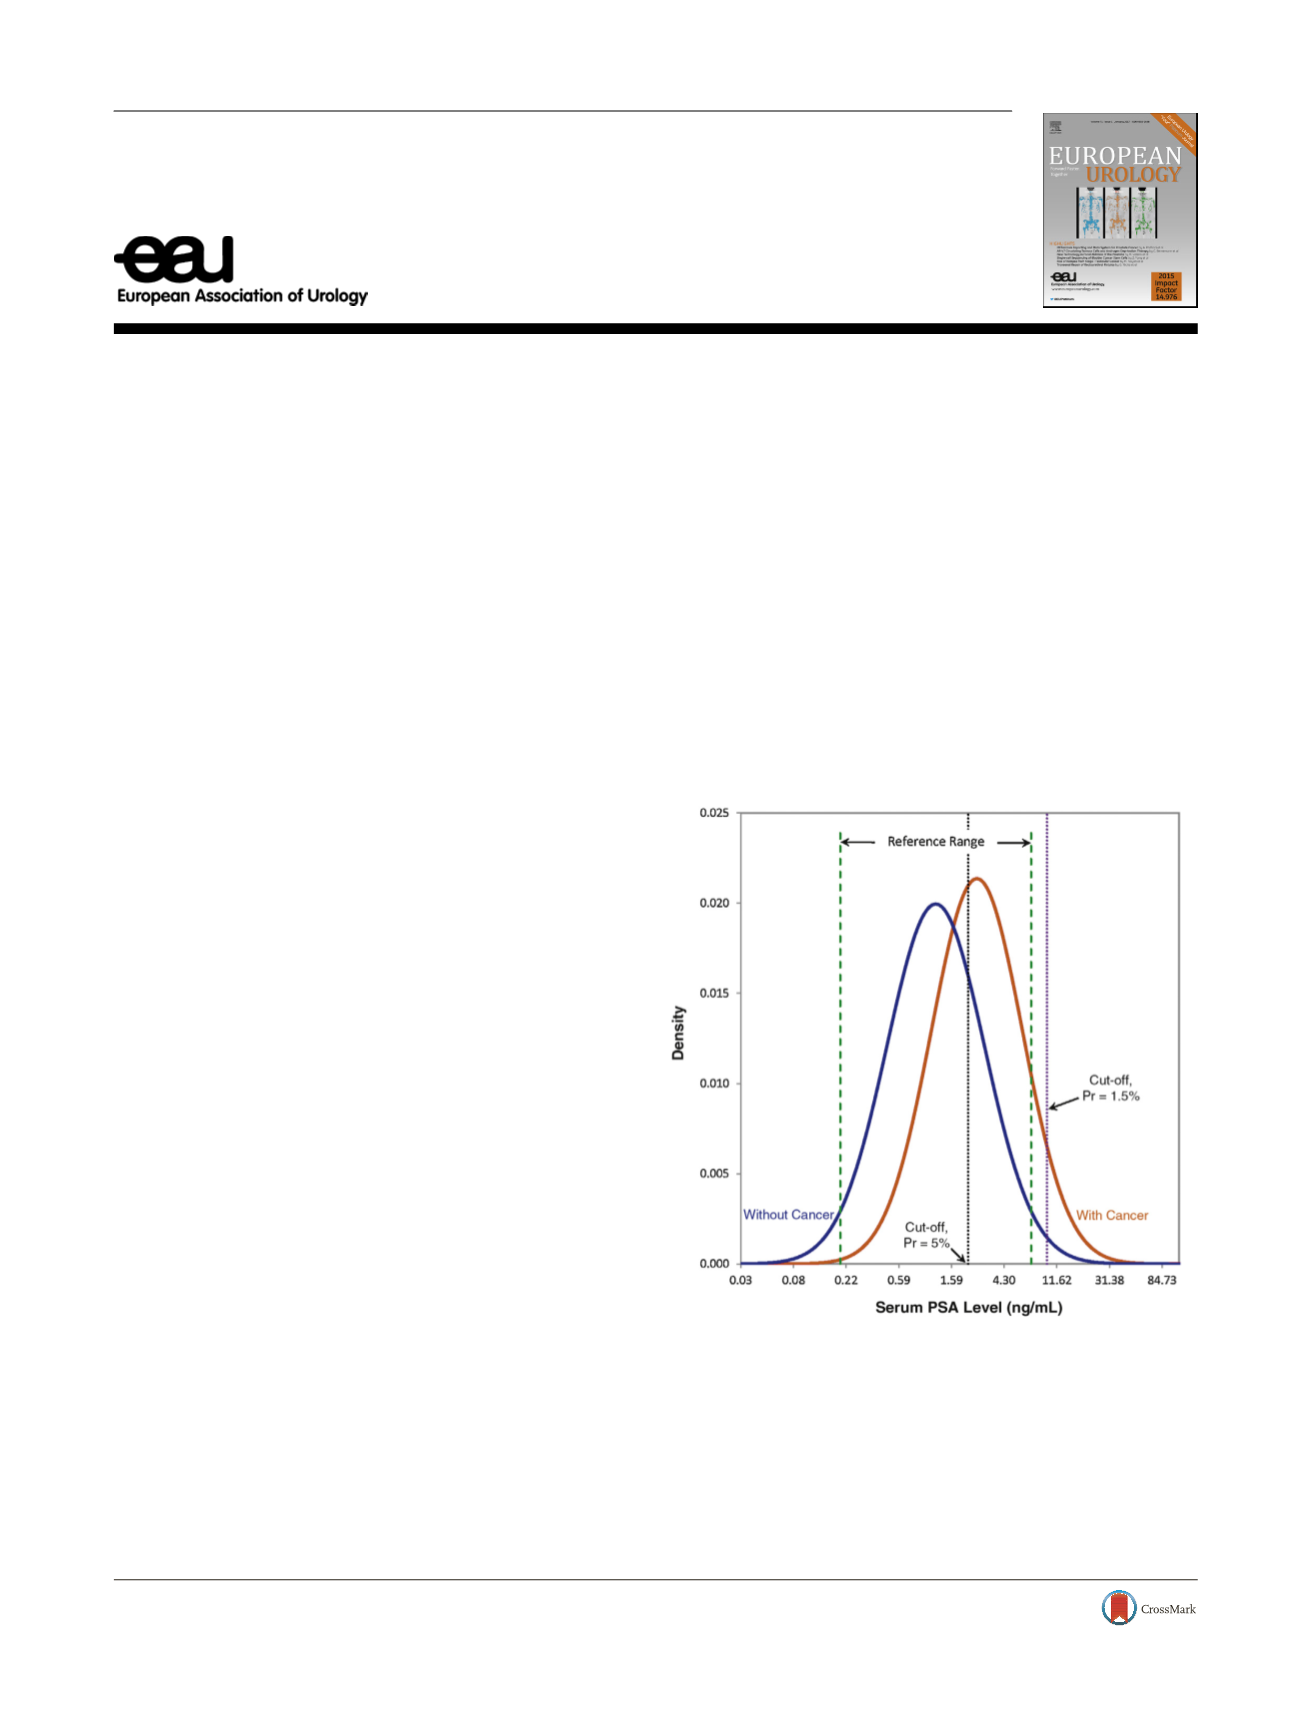
Punglia et al
[5]showed that the reference range for
serum prostate specific antigen (PSA) in a group of healthy
men older than 60 yr with normal digital rectal examination
is 0.21–7.34 ng/ml (mean 1.23, standard deviation [SD]
2.48). They also showed that the mean PSA level amongmen
with prostate cancer aged 60 yr, also with normal digital
rectal examination, is 2.66 ng/ml (SD 2.34;
Fig. 1 ).
A patient with prostate cancer but a false-negative test
returns in a worse condition needing more extensive
treatments, and with an ultimate lower survival rate.
Conversely, a false-positive result for a man without the
cancer causes him to undergo prostate biopsy and the
associated risk of complications, plus the psychological
trauma to him and his family members. Assume that the
costs associated with a false-negative result are 15 times
those for a false-positive result. Considering the above-
mentioned information about the distribution of PSA in
men with and without prostate cancer, the most appropri-
ate cutoff values are 2.18 and 9.65 ng/ml for prostate cancer
prevalence of 5% and 1.5%, respectively
[2] .There is nothing specific to PSA in the above example;
it can thus be extended to any tests with continuous
results, such as many tumor markers. The important point
is that the most appropriate test cutoff value changes with
the prevalence (more precisely, the prior probability)
of the disease of interest in the population being
studied.
E U R O P E A N U R O L O G Y 7 2 ( 2 0 1 7 ) 8 5 9 – 8 6 0ava ilable at
www.sciencedirect.comjournal homepage:
www.eu ropeanurology.com[(Fig._1)TD$FIG]
Fig. 1 – Distribution of serum prostate specific antigen (PSA) among men
aged
I
60 yr without (blue curve) and with (red curve) prostate cancer.
The PSA reference range (interval between green dashed lines) is solely
derived from the distribution of PSA among men without the cancer.
Assuming that the costs associated with a false-negative test are 15 times
those for a false-positive result, the PSA cutoff values for diagnosis of
prostate cancer are 2.18 ng/ml (black dotted line) and 9.65 ng/ml (purple
dotted line) for a pretest probability (prevalence of prostate cancer, Pr) of
5% and 1.5%, respectively. The data for plotting the curves are from
Punglia et al
[5]. Note that the x-axis has a logarithmic scale because PSA
distributions in both populations are positively skewed. Cutoff values
were calculated following Habibzadeh et al
[2].
http://dx.doi.org/10.1016/j.eururo.2017.05.0240302-2838/
#
2017 European Association of Urology. Published by Elsevier B.V. All rights reserved.