


 751 860

respectively)
[25,28], the reduced GRS effect estimate was
attenuated but remained statistically significant
(OR = 1.73 per predicted kilobase increase, 95% CI = 1.36
–
2.21,
p
<
0.0001; Supplementary Fig. 2).
A similar direct relationship between telomere length-
associated genetic variants and RCC risk was observedwhen
applying summary statistic based approaches to our RCC
cases and controls. The likelihood-based pooled estimate
for a predicted kilobase increase in telomere length is a
2.00 increase in the odds of developing RCC (95% CI = 1.64
–
2.43,
p
<
0.0001;
Fig. 3). Likewise, the inverse variance
weighted method gave a similar effect estimate (OR = 1.96,
95% CI = 1.63
–
2.35,
p
<
0.0001). There was no significant
heterogeneity when comparing the ratio of effect sizes of
the genetic variants on telomere length to the effect sizes of
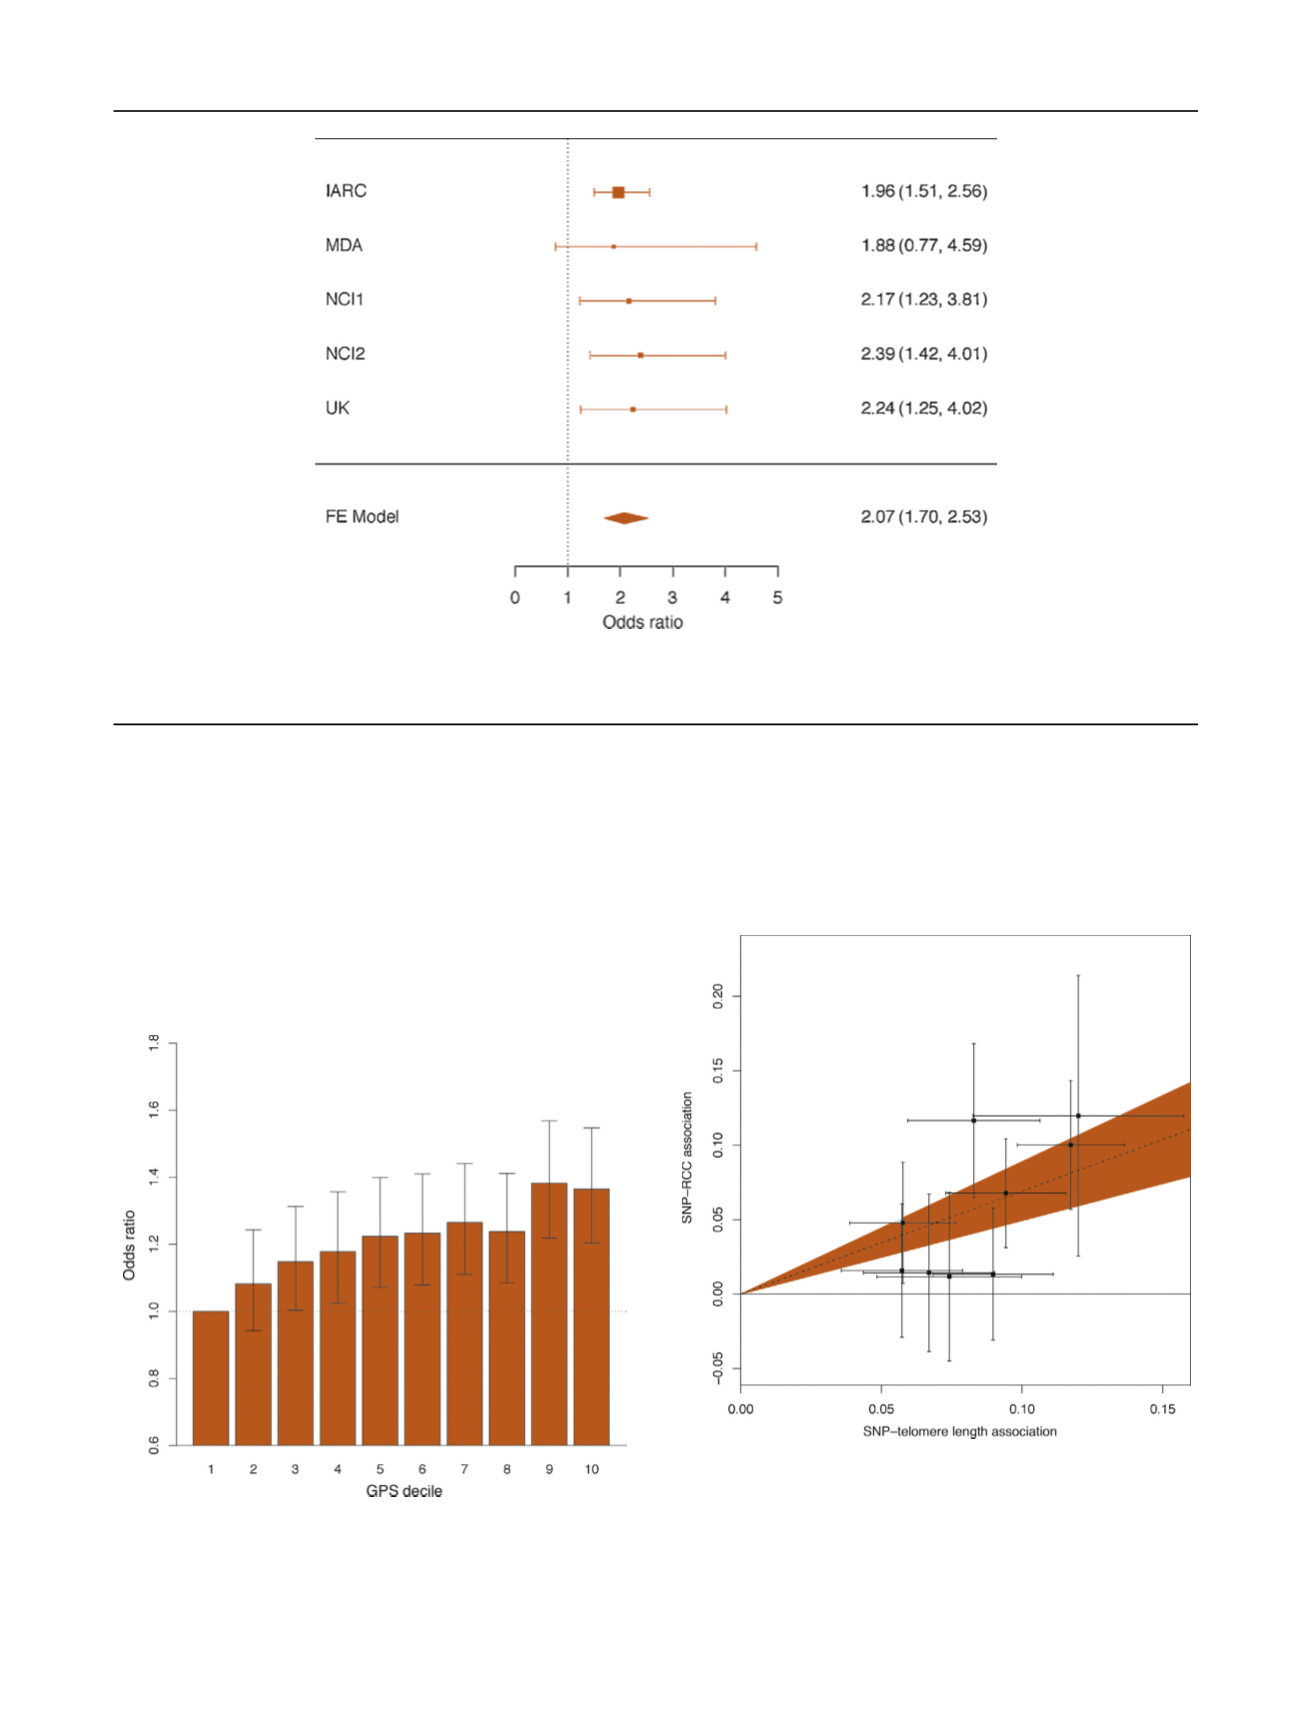
[(Fig._1)TD$FIG]
Fig. 1
–
Forest plot for associations of the telomere length associated genetic risk score with renal cell carcinoma risk. Odds ratios are scaled to
predicted kilobase increase in telomere length. Combined association
p
<
0.0001. Heterogeneity
p
= 0.96.
FE = fixed effects; IARC = International Agency for Cancer Research; MDA = MD Anderson Cancer Center; NCI = National Cancer Institute.
[(Fig._3)TD$FIG]
Fig. 3
–
The effect of each variant on telomere length and renal cell
carcinoma (RCC) risk. Estimates for the single nucleotide polymorphism
(SNP)
–
telomere and SNP
–
RCC associations are presented in
Table 1. Error bars around each estimate are 95% confidence intervals
around the
b
estimate. A best fit regression line (dashed line) and 95%
confidence interval (shaded region) are plotted using the likelihood
based estimate (odds ratio = 2.00, 95% confidence interval = 1.64
–
2.43,
p
<
0.0001).
[(Fig._2)TD$FIG]
Fig. 2
–
Associations of telomere length genetic risk score (GRS) decile
with renal cell carcinoma. Dashed line represents the baseline for the
reference decile (lowest decile). Error bars represent 95% confidence
intervals around the odds ratio association for each GRS decile and
renal cell carcinoma.
E U R O P E A N U R O L O GY 7 2 ( 2 0 17 ) 74 7
–
7 5 4
751