


 741 860

DE-EBRT increased from 71% to 86%
( Fig. 1 ). Patients with
intermediate and high risk experienced a similar decline in
the proportion receiving LDR-B, and the interaction
between risk group and year had no effect on LDR-B boost
treatment selection (
p
= 0.2).
3.3.
Survival analysis
On UVA, LDR-B boost was associated with better (hazard
ratio [HR] 0.63, 95% confidence interval [CI] 0.58–0.68;
p
<
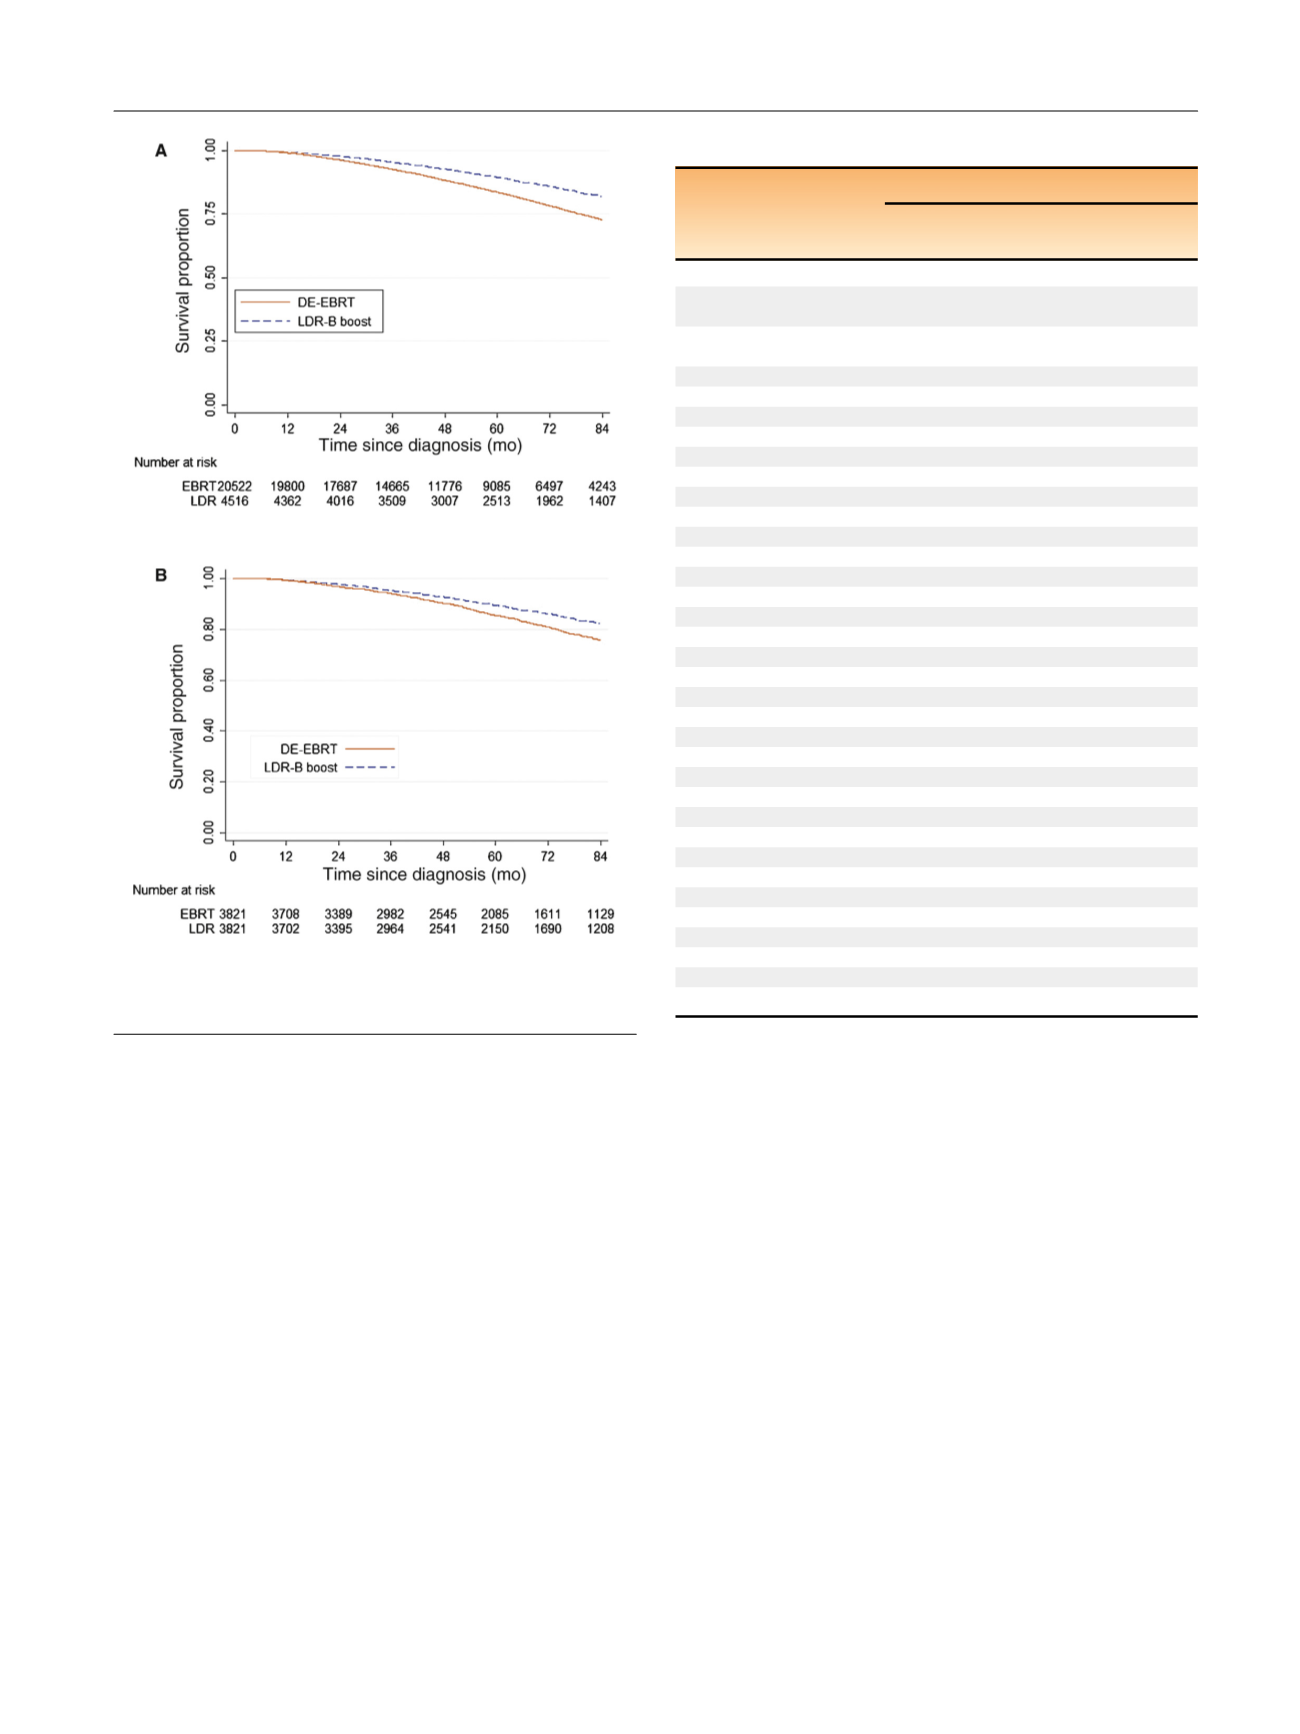
0.001) when compared to DE-EBRT. The 7-yr OS was
82%for LDR-B boost and 73% for the DE-EBRT group
( Fig. 2 A). On MVA, LDR-B boost remained independently
associated with better OS (HR 0.70, 95% CI 0.64–0.77). Other
significant variables associated with OS on UVA and MVA
are shown in
Table 2.
3.4.
Propensity score matching
Propensity score matching identified a cohort of
7642 patients without significant differences in matching
factors found to be associated with treatment selection
(Supplementary Table 2). Of these, 3821 received LDR-B
boost, and 3821 received EBRT alone. Comparison of
propensity score–matched samples confirmed better OS
associated with LDR-B boost (HR 0.74, 95% CI 0.66–0.89;
7-yr OS 82% vs 76%;
Fig. 2B). On sensitivity analysis, the
difference between DE-EBRT and LDR-B boost remained
until 80% of DE-EBRT patients with GS 7 disease were
artificially increased to GS 8–10.
3.5.
Subset analyses
When limiting the analysis to those younger than 60 yr with
no comorbidities to approximate PCa deaths, the benefit of
LDR-B boost persisted, with 7-yr OS of 90% compared to 85%
for DE-EBRT (log-rank
p
<
0.001;
Fig. 3 ). For all patients,
there was no interaction between treatment and age
(
p
= 0.92), treatment and risk group (
p
= 0.82), treatment
and dose (
p
= 0.66), or risk group and dose (
p
= 0.86).
4.
Discussion
Our findings suggest that men with unfavorable-risk PCa
who were selected to undergo LDR-B boost survived longer
Table 2 – Overall survival analyses from 2004 to 2012
Variable
Hazard ratio (95% confidence interval)
Univariate
analysis
Multivariate
analysis
Treatment
External-beam
radiation therapy
Reference
Reference
Low-dose rate
brachytherapy
0.63 (0.58–0.68)
0.70 (0.64–0.77)
Age (continuous)
1.05 (1.05–1.06)
1.05 (1.04–1.05)
Race
Black
Reference
Reference
Non-Hispanic white
1.14 (1.05–1.24)
1.00 (0.91–1.10)
Other
0.73 (0.55–0.96)
0.68 (0.50–0.92)
Insurance
Medicare
Reference
Reference
Uninsured
0.50 (0.35–0.71)
0.84 (0.57–1.26)
Private
0.57 (0.53–0.62)
0.92 (0.84–1.01)
Medicaid
0.95 (0.78–1.15)
1.57 (1.26–1.97)
Government/unknown 0.92 (0.78–1.09)
1.18 (0.98–1.43)
Geographic region
Northeast
Reference
Reference
South
1.06 (0.98–1.15)
1.07 (0.99–1.17)
Midwest
1.15 (1.06–1.24)
1.09 (1.00–1.19)
West
1.01 (0.92–1.11)
0.97 (0.88–1.08)
Facility type
Academic
Reference
Reference
Nonacademic
1.10 (1.03–1.18)
1.13 (1.04–1.22)
Charlson comorbidity score
0
Reference
Reference
1
1.38 (1.27–1.51)
1.44 (1.31–1.58)
2+
2.56 (2.21–2.96)
2.50 (2.13–2.95)
Gleason score
6
Reference
Reference
7
1.11 (0.99–1.25)
1.15 (1.01–1.31)
8–10
1.58 (1.41–1.77)
1.50 (1.32–1.70)
PSA (continuous)
1.001 (1.001–1.002)
1.002 (1.001–1.002)
Clinical stage
T1c–T2a
Reference
Reference
T2b–T2c
1.25 (1.17–1.34)
1.21 (1.13–1.30)
T3a
1.34 (1.16–1.55)
1.25 (1.07–1.46)
[(Fig._2)TD$FIG]
Fig. 2 – (A) Unadjusted and (B) propensity-matched Kaplan-Meier
survival curves by either dose-escalated external beam radiation
therapy (DE-EBRT) or low-dose-rate brachytherapy (LDR-B) boost.
E U R O P E A N U R O L O G Y 7 2 ( 2 0 1 7 ) 7 3 8 – 7 4 4
741