


 740 860

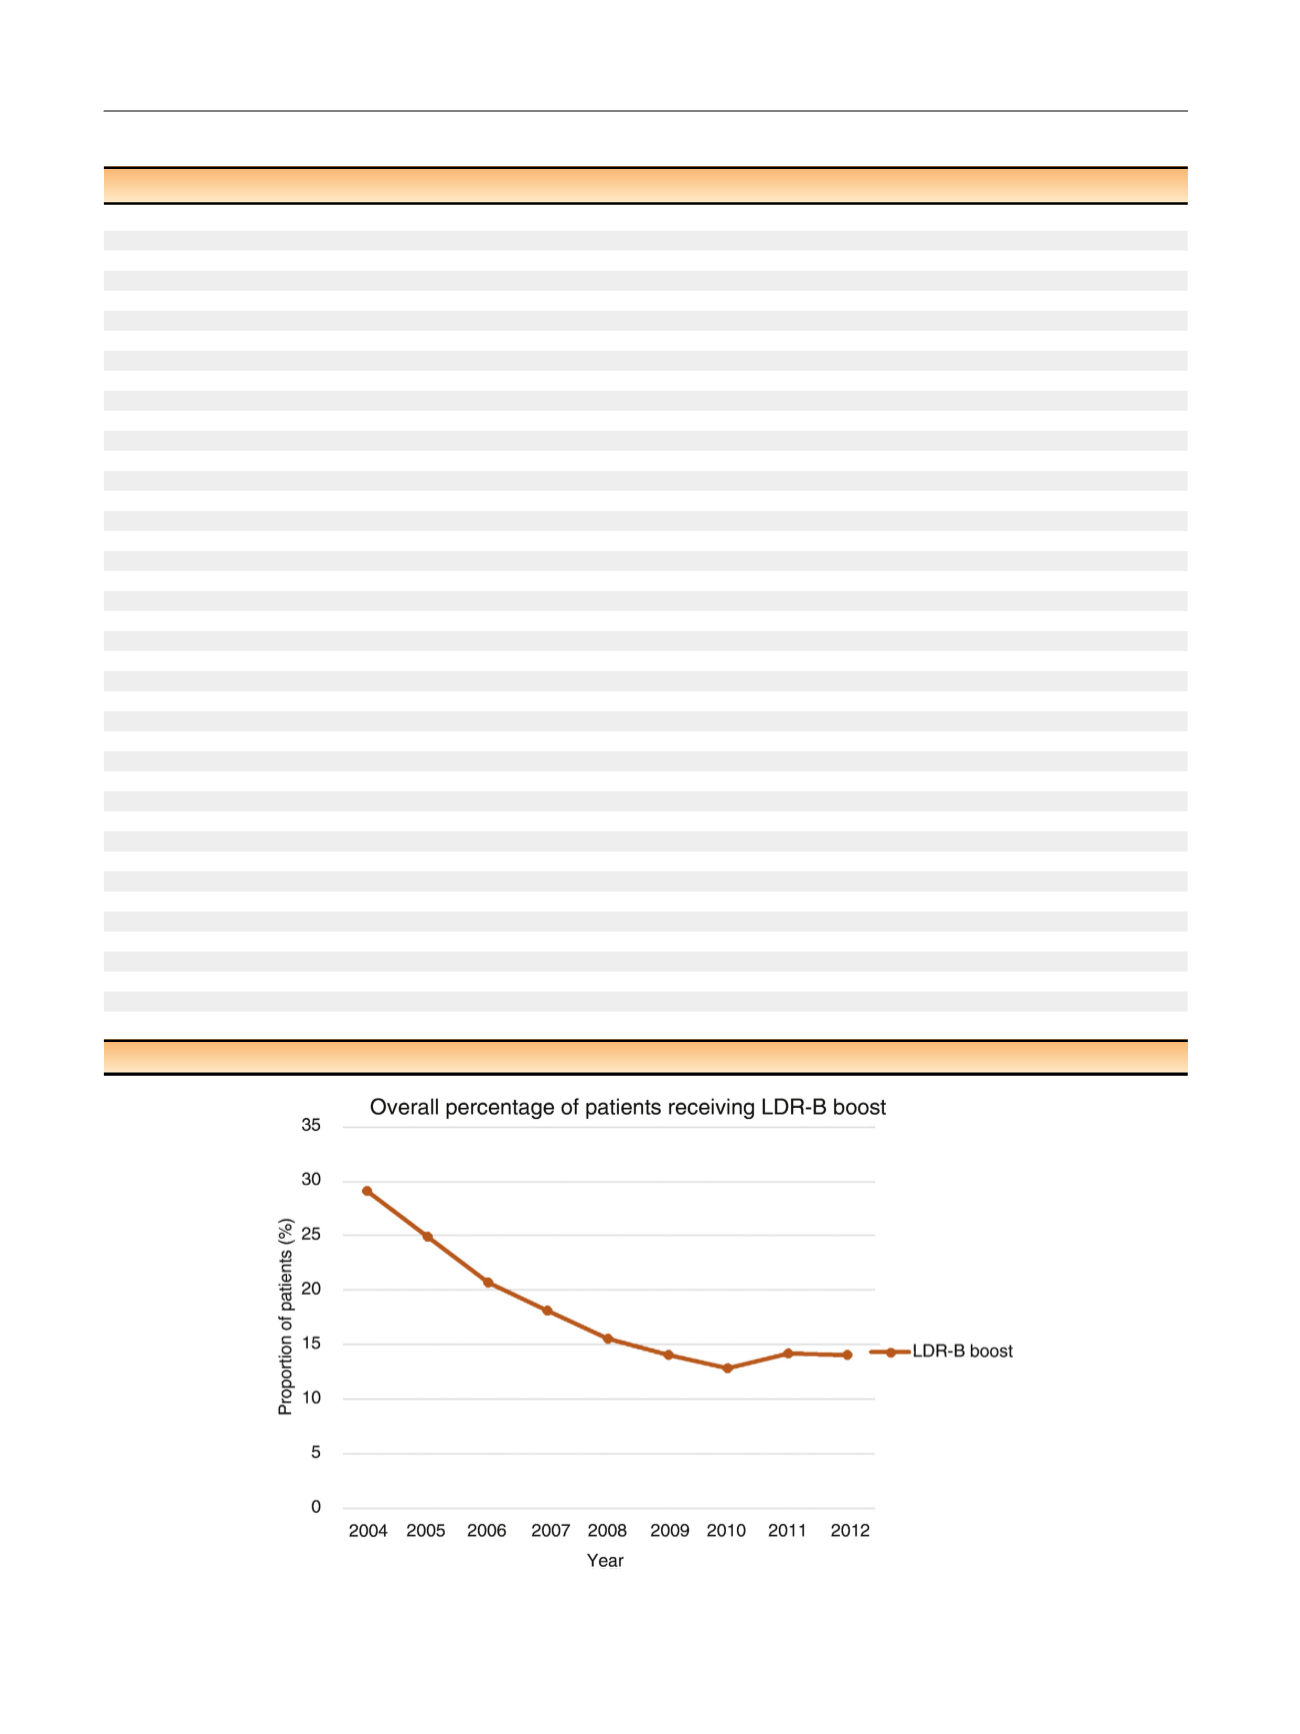
Table 1 – Patient demographics and clinical characteristics
Characteristic
EBRT
LDR-B boost
p
value
Patients,
n
(%)
20 522 (82)
4516 (18)
Median follow-up, mo (IQR)
61 (37–86)
71 (43–95)
<
0.001
Median treatment year (IQR)
2008 (2006–2010)
2007 (2005–2009)
<
0.001
Mean age, yr (SD)
70 (7.7)
67 (7.6)
<
0.001
Race,
n
(%)
20 299 (82)
4475 (18)
0.01
Black
3201 (16)
787 (18)
Non-Hispanic white
16 698 (82)
3604 (80)
Other
400 (2)
84 (2)
Insurance,
n
(%)
20 624 (82)
4540 (18)
<
0.001
Medicare
13 913 (68)
2629 (58)
Uninsured
287 (1)
45 (1)
Private
4933 (24)
1654 (36)
Medicaid
553 (3)
99 (2)
Government/unknown
836 (4)
89 (2)
Geographic region,
n
(%)
20 521 (82)
4515 (18)
<
0.001
Northeast
5626 (27)
1088 (24)
South
5858(29)
1894 (42)
Midwest
5999 (29)
989 (22)
West
3038 (15)
544 (12)
Facility type,
n
(%)
19 413 (82)
4174 (18)
<
0.001
Academic
5384 (28)
761 (18)
Nonacademic
14 029 (72)
3413 (82)
CCS,
n
(%)
20 522 (82)
4516 (18)
0.001
0
17 745 (87)
3893 (86)
1
2271 (11)
549 (12)
2+
506 (2)
74 (2)
Risk group,
n
(%)
20 047 (82)
4427 (18)
<
0.001
Intermediate
8971 (45)
2500 (56)
High
11 076 (55)
1927 (44)
Gleason score,
n
(%)
19 624 (82)
4353 (18)
<
0.001
6
1486 (8)
373 (9)
7
9237 (47)
2460 (56)
8-10
8901 (45)
1520 (35)
PSA,
n
(%)
20 522 (82)
4516 (18)
<
0.001
<
10 ng/ml
11 597 (56)
2928 (65)
10 to
<
20 ng/ml
5900 (29)
1122 (25)
20 to
<
40 ng/ml
3025 (15)
466 (10)
Clinical stage,
n
(%)
18 908 (82)
4283 (18)
<
0.001
T1c–T2a
12 703 (67)
3023 (71)
T2b–T2c
5379 (29)
1164 (27)
T3a
826 (4)
96 (2)
EBRT = external-beam radiation therapy; LDR = low-dose rate; IQR = interquartile range; SD = standard deviation; CCS = Charlson comorbidity score.
[(Fig._1)TD$FIG]
Fig. 1 – Proportion of patients treated with androgen suppression and external-beam radiation with low-dose rate brachytherapy (LDR-B) boost
between 2004 and 2012 relative to dose-escalated external beam radiation therapy alone.
E U R O P E A N U R O L O G Y 7 2 ( 2 0 1 7 ) 7 3 8 – 7 4 4
740